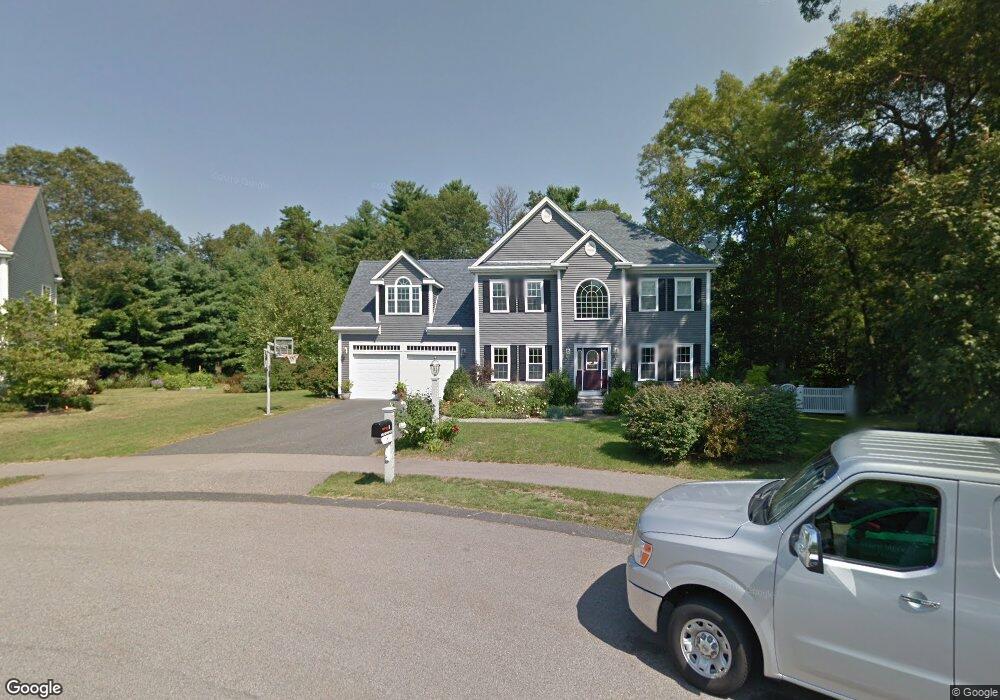
5 Grapevine Way Medway, MA 02053
Estimated Value: $992,000 - $1,079,000
4
Beds
3
Baths
3,200
Sq Ft
$320/Sq Ft
Est. Value
About This Home
This home is located at 5 Grapevine Way, Medway, MA 02053 and is currently estimated at $1,025,152, approximately $320 per square foot. 5 Grapevine Way is a home located in Norfolk County with nearby schools including John D. McGovern Elementary School, Burke-Memorial Elementary, and Medway Middle School.
Ownership History
Date
Name
Owned For
Owner Type
Purchase Details
Closed on
Oct 12, 2006
Sold by
Rojee & Leland Homes I
Bought by
Green Gregory A and Green Kevin A
Current Estimated Value
Home Financials for this Owner
Home Financials are based on the most recent Mortgage that was taken out on this home.
Original Mortgage
$417,000
Outstanding Balance
$248,970
Interest Rate
6.47%
Mortgage Type
Purchase Money Mortgage
Estimated Equity
$776,182
Create a Home Valuation Report for This Property
The Home Valuation Report is an in-depth analysis detailing your home's value as well as a comparison with similar homes in the area
Home Values in the Area
Average Home Value in this Area
Purchase History
| Date | Buyer | Sale Price | Title Company |
|---|---|---|---|
| Green Gregory A | $570,000 | -- |
Source: Public Records
Mortgage History
| Date | Status | Borrower | Loan Amount |
|---|---|---|---|
| Open | Green Gregory A | $417,000 |
Source: Public Records
Tax History Compared to Growth
Tax History
| Year | Tax Paid | Tax Assessment Tax Assessment Total Assessment is a certain percentage of the fair market value that is determined by local assessors to be the total taxable value of land and additions on the property. | Land | Improvement |
|---|---|---|---|---|
| 2025 | $13,040 | $915,100 | $341,800 | $573,300 |
| 2024 | $13,177 | $915,100 | $341,800 | $573,300 |
| 2023 | $12,202 | $765,500 | $311,300 | $454,200 |
| 2022 | $11,399 | $673,300 | $230,700 | $442,600 |
| 2021 | $11,489 | $658,000 | $215,400 | $442,600 |
| 2020 | $11,344 | $648,200 | $215,400 | $432,800 |
| 2019 | $10,795 | $636,100 | $206,700 | $429,400 |
| 2018 | $11,108 | $629,000 | $206,700 | $422,300 |
| 2017 | $10,743 | $599,500 | $198,000 | $401,500 |
| 2016 | $10,660 | $588,600 | $187,100 | $401,500 |
| 2015 | $10,612 | $581,800 | $187,100 | $394,700 |
| 2014 | $9,616 | $510,400 | $189,100 | $321,300 |
Source: Public Records
Map
Nearby Homes