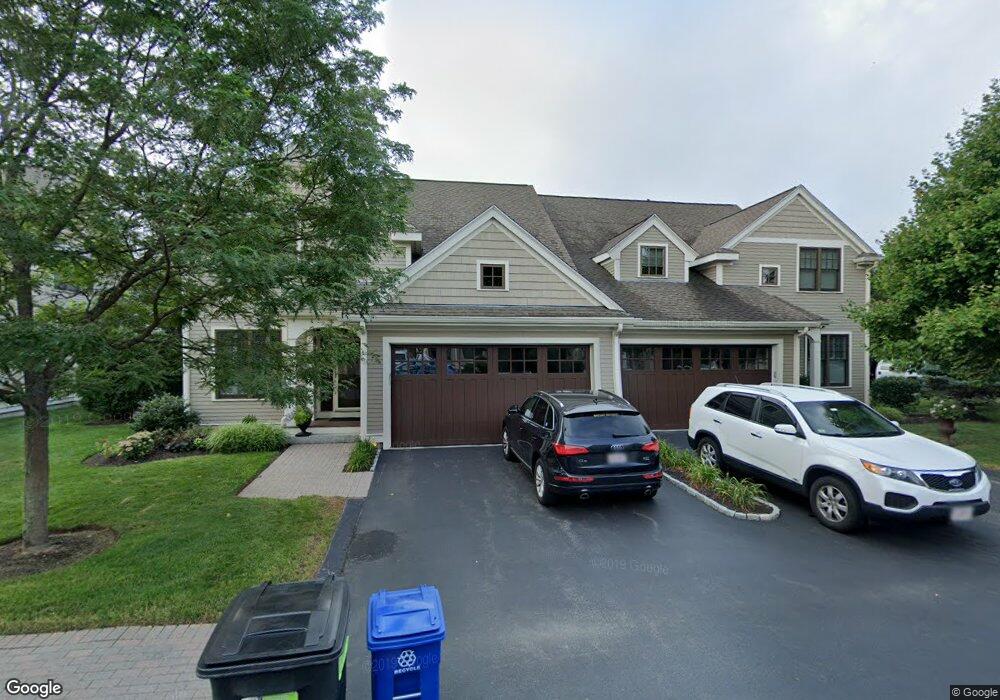
5 Graystone Cir Unit 5 Winchester, MA 01890
The Flats NeighborhoodEstimated Value: $1,623,000 - $1,794,000
2
Beds
4
Baths
3,574
Sq Ft
$479/Sq Ft
Est. Value
About This Home
This home is located at 5 Graystone Cir Unit 5, Winchester, MA 01890 and is currently estimated at $1,712,717, approximately $479 per square foot. 5 Graystone Cir Unit 5 is a home located in Middlesex County with nearby schools including Vinson-Owen Elementary School, McCall Middle School, and Winchester High School.
Ownership History
Date
Name
Owned For
Owner Type
Purchase Details
Closed on
May 31, 2023
Sold by
Deltergo Phyllis
Bought by
5 Graystone Circle Nt and Deltergo
Current Estimated Value
Purchase Details
Closed on
Sep 20, 2021
Sold by
Swain Suzanne C
Bought by
Deltergo Phyllis
Purchase Details
Closed on
Oct 21, 2016
Sold by
Benjamin J Newman Ret
Bought by
Swain Suzanne C
Home Financials for this Owner
Home Financials are based on the most recent Mortgage that was taken out on this home.
Original Mortgage
$1,740,000
Interest Rate
4%
Mortgage Type
Adjustable Rate Mortgage/ARM
Purchase Details
Closed on
Aug 17, 2012
Sold by
Newman Benjam I and Newman Ellen M
Bought by
Benjamin J Newman Ret
Purchase Details
Closed on
May 23, 2011
Sold by
Duffy Realty Llc
Bought by
Newman Benjamin J and Newman Ellen M
Home Financials for this Owner
Home Financials are based on the most recent Mortgage that was taken out on this home.
Original Mortgage
$263,000
Interest Rate
8%
Mortgage Type
Adjustable Rate Mortgage/ARM
Create a Home Valuation Report for This Property
The Home Valuation Report is an in-depth analysis detailing your home's value as well as a comparison with similar homes in the area
Home Values in the Area
Average Home Value in this Area
Purchase History
| Date | Buyer | Sale Price | Title Company |
|---|---|---|---|
| 5 Graystone Circle Nt | -- | None Available | |
| Deltergo Phyllis | $1,500,000 | None Available | |
| Swain Suzanne C | $1,310,000 | -- | |
| Benjamin J Newman Ret | -- | -- | |
| Newman Benjamin J | $869,000 | -- |
Source: Public Records
Mortgage History
| Date | Status | Borrower | Loan Amount |
|---|---|---|---|
| Previous Owner | Swain Suzanne C | $1,740,000 | |
| Previous Owner | Newman Benjamin J | $263,000 |
Source: Public Records
Tax History Compared to Growth
Tax History
| Year | Tax Paid | Tax Assessment Tax Assessment Total Assessment is a certain percentage of the fair market value that is determined by local assessors to be the total taxable value of land and additions on the property. | Land | Improvement |
|---|---|---|---|---|
| 2025 | $165 | $1,488,500 | $0 | $1,488,500 |
| 2024 | $16,195 | $1,429,400 | $0 | $1,429,400 |
| 2023 | $16,906 | $1,432,700 | $0 | $1,432,700 |
| 2022 | $17,568 | $1,404,300 | $0 | $1,404,300 |
| 2021 | $17,478 | $1,362,300 | $0 | $1,362,300 |
| 2020 | $15,473 | $1,248,800 | $0 | $1,248,800 |
| 2019 | $15,123 | $1,248,800 | $0 | $1,248,800 |
| 2018 | $15,563 | $1,276,700 | $0 | $1,276,700 |
| 2017 | $14,606 | $1,189,400 | $0 | $1,189,400 |
| 2016 | $10,784 | $923,300 | $0 | $923,300 |
| 2015 | $10,387 | $855,600 | $0 | $855,600 |
| 2014 | $10,548 | $833,200 | $0 | $833,200 |
Source: Public Records
Map
Nearby Homes
- 89 Wildwood St
- 44 Cabot St
- 32 Woodside Rd
- 9 Norfolk Rd
- 7 Wainwright Rd Unit 118
- 6 Ivy Cir
- 1 Copley St
- 269 Cambridge Rd Unit 203
- 273 Cambridge Rd Unit 202
- 149 Horn Pond Brook Rd
- 15 Wildwood St
- 104 Church St
- 6 Wyman Ct Unit 6
- 4 Wyman Ct Unit 4
- 10 Sheffield Rd
- 19 Glengarry Rd
- 62 Richardson St
- 20 Amberwood Dr
- 139 High St
- 2 Everett Ave
- 2 Graystone Cir Unit 2
- 8 Graystone Cir Unit 8
- 27 Pond St
- 14 Graystone Cir Unit 14C1
- 8 Graystone Cir
- 36 Graystone Cir Unit 36
- 53 Graystone Cir Unit 53
- 37 Graystone Cir Unit 37C1
- 34 Graystone Cir Unit 34
- 37 Graystone Cir
- 39 Graystone Cir Unit 39
- 16 Graystone Cir Unit 16
- 25 Pond St Unit 25
- 58 Graystone Cir
- 7 Graystone Cir Unit 7
- 38 Graystone Cir Unit 38
- 52 Graystone Cir Unit 52
- 46 Graystone Cir Unit 46
- 6 Graystone Cir Unit 6
- 11 Graystone Cir Unit 11