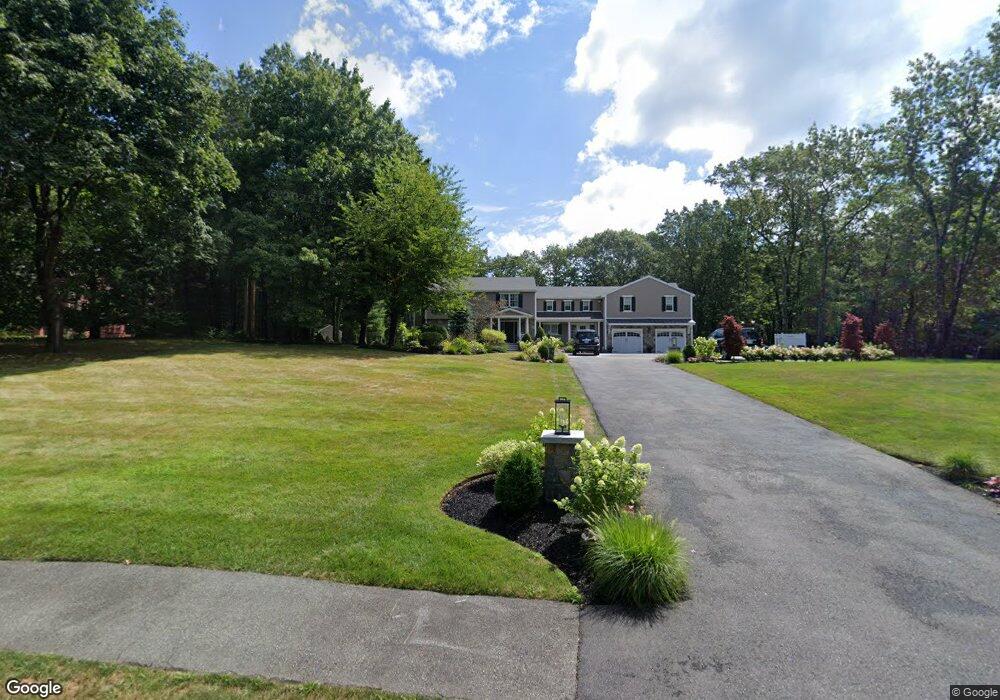
5 Greenway Rd Middleton, MA 01949
Estimated Value: $1,292,000 - $1,762,000
3
Beds
4
Baths
3,100
Sq Ft
$507/Sq Ft
Est. Value
About This Home
This home is located at 5 Greenway Rd, Middleton, MA 01949 and is currently estimated at $1,570,791, approximately $506 per square foot. 5 Greenway Rd is a home located in Essex County with nearby schools including Howe-Manning Elementary School, Fuller Meadow Elementary School, and Masconomet Regional Middle School.
Ownership History
Date
Name
Owned For
Owner Type
Purchase Details
Closed on
Nov 19, 2018
Sold by
Connor Frank J and Feldberg Nichole D
Bought by
Feldberg Connors T
Current Estimated Value
Purchase Details
Closed on
Nov 8, 2013
Sold by
Zaniboni Brian J and Zaniboni Lori A
Bought by
Connor Frank J and Feldberg Nichole D
Home Financials for this Owner
Home Financials are based on the most recent Mortgage that was taken out on this home.
Original Mortgage
$464,925
Interest Rate
4.36%
Mortgage Type
New Conventional
Purchase Details
Closed on
Oct 29, 1999
Sold by
Harrington Paul M and Harrington Patricia A
Bought by
Zaniboni Brian J and Zaniboni Lori A
Create a Home Valuation Report for This Property
The Home Valuation Report is an in-depth analysis detailing your home's value as well as a comparison with similar homes in the area
Home Values in the Area
Average Home Value in this Area
Purchase History
| Date | Buyer | Sale Price | Title Company |
|---|---|---|---|
| Feldberg Connors T | -- | -- | |
| Feldberg Connors T | -- | -- | |
| Connor Frank J | $619,900 | -- | |
| Connor Frank J | $619,900 | -- | |
| Zaniboni Brian J | $300,000 | -- | |
| Zaniboni Brian J | $300,000 | -- |
Source: Public Records
Mortgage History
| Date | Status | Borrower | Loan Amount |
|---|---|---|---|
| Previous Owner | Connor Frank J | $464,925 | |
| Previous Owner | Zaniboni Brian J | $30,995 |
Source: Public Records
Tax History Compared to Growth
Tax History
| Year | Tax Paid | Tax Assessment Tax Assessment Total Assessment is a certain percentage of the fair market value that is determined by local assessors to be the total taxable value of land and additions on the property. | Land | Improvement |
|---|---|---|---|---|
| 2025 | $16,782 | $1,411,400 | $396,600 | $1,014,800 |
| 2024 | $14,187 | $1,203,300 | $416,600 | $786,700 |
| 2023 | $12,580 | $977,500 | $342,600 | $634,900 |
| 2022 | $12,193 | $920,200 | $373,900 | $546,300 |
| 2021 | $10,920 | $795,900 | $265,900 | $530,000 |
| 2020 | $10,828 | $795,000 | $259,900 | $535,100 |
| 2019 | $10,936 | $798,800 | $283,900 | $514,900 |
| 2018 | $11,055 | $791,900 | $283,900 | $508,000 |
| 2017 | $7,543 | $540,700 | $273,900 | $266,800 |
| 2016 | $7,102 | $511,300 | $247,900 | $263,400 |
| 2015 | $6,927 | $502,700 | $243,900 | $258,800 |
Source: Public Records
Map
Nearby Homes