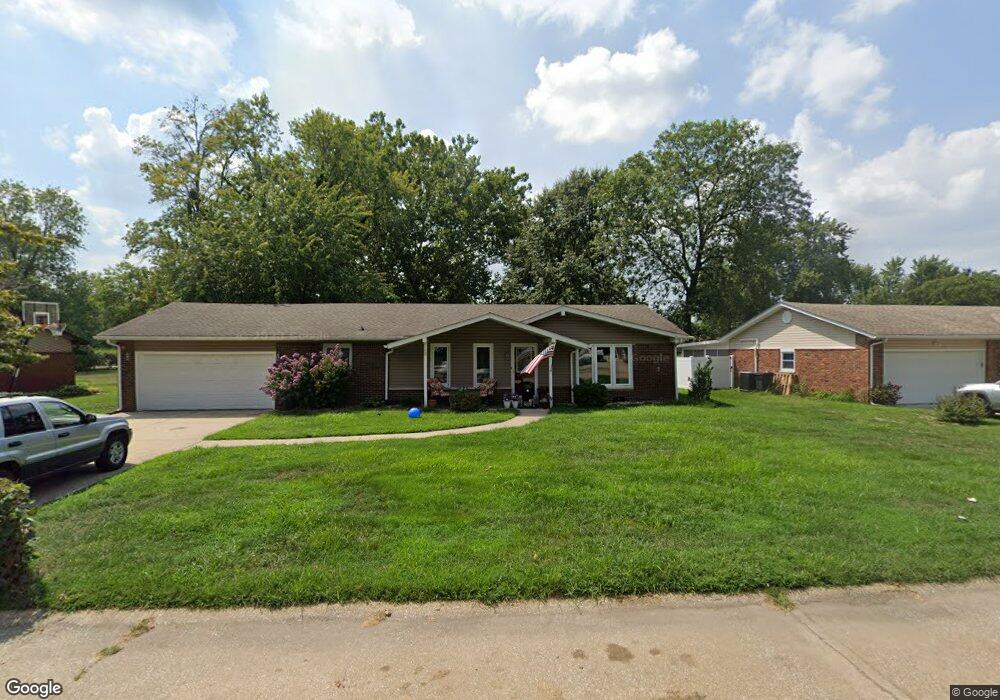
5 Hanson Dr Granite City, IL 62040
Horseshoe Lake NeighborhoodEstimated Value: $189,578 - $255,000
3
Beds
2
Baths
1,344
Sq Ft
$165/Sq Ft
Est. Value
About This Home
This home is located at 5 Hanson Dr, Granite City, IL 62040 and is currently estimated at $222,395, approximately $165 per square foot. 5 Hanson Dr is a home located in Madison County with nearby schools including Granite City High School, Rivers of Life Christian School, and Good Shepherd Lutheran School.
Ownership History
Date
Name
Owned For
Owner Type
Purchase Details
Closed on
Aug 1, 2023
Sold by
Duncan Melody
Bought by
Duncan Melody
Current Estimated Value
Home Financials for this Owner
Home Financials are based on the most recent Mortgage that was taken out on this home.
Original Mortgage
$125,000
Outstanding Balance
$122,377
Interest Rate
7.25%
Mortgage Type
New Conventional
Estimated Equity
$100,018
Purchase Details
Closed on
Oct 3, 2013
Sold by
Hill Eric and Hill Christina
Bought by
Henderson John and Henderson Melody
Home Financials for this Owner
Home Financials are based on the most recent Mortgage that was taken out on this home.
Original Mortgage
$150,818
Interest Rate
4.56%
Mortgage Type
VA
Purchase Details
Closed on
Jul 7, 2009
Sold by
Monical Georgetta
Bought by
Hill Eric and Hill Christina
Home Financials for this Owner
Home Financials are based on the most recent Mortgage that was taken out on this home.
Original Mortgage
$116,000
Interest Rate
6.25%
Mortgage Type
Purchase Money Mortgage
Create a Home Valuation Report for This Property
The Home Valuation Report is an in-depth analysis detailing your home's value as well as a comparison with similar homes in the area
Home Values in the Area
Average Home Value in this Area
Purchase History
| Date | Buyer | Sale Price | Title Company |
|---|---|---|---|
| Duncan Melody | -- | None Available | |
| Henderson John | $146,000 | Metro Title & Escrow Co | |
| Hill Eric | $87,500 | First American Title Ins Co |
Source: Public Records
Mortgage History
| Date | Status | Borrower | Loan Amount |
|---|---|---|---|
| Open | Duncan Melody | $125,000 | |
| Previous Owner | Henderson John | $150,818 | |
| Previous Owner | Hill Eric | $116,000 |
Source: Public Records
Tax History Compared to Growth
Tax History
| Year | Tax Paid | Tax Assessment Tax Assessment Total Assessment is a certain percentage of the fair market value that is determined by local assessors to be the total taxable value of land and additions on the property. | Land | Improvement |
|---|---|---|---|---|
| 2024 | $2,487 | $47,320 | $10,560 | $36,760 |
| 2023 | $2,487 | $41,220 | $9,200 | $32,020 |
| 2022 | $2,328 | $37,410 | $8,350 | $29,060 |
| 2021 | $2,092 | $35,560 | $7,940 | $27,620 |
| 2020 | $2,020 | $34,400 | $7,680 | $26,720 |
| 2019 | $2,036 | $33,710 | $7,470 | $26,240 |
| 2018 | $1,997 | $31,790 | $7,040 | $24,750 |
| 2017 | $1,920 | $31,790 | $7,040 | $24,750 |
| 2016 | $2,068 | $31,790 | $7,040 | $24,750 |
| 2015 | $1,948 | $31,890 | $7,060 | $24,830 |
| 2014 | $1,948 | $31,890 | $7,060 | $24,830 |
| 2013 | $1,948 | $32,780 | $7,260 | $25,520 |
Source: Public Records
Map
Nearby Homes
- 137 Arlington Dr
- 206 Holiday Mobile Home Park
- Sunrise Plan at Windsor Village - Windsor Estates
- Covington 2 Car Plan at Windsor Village - Windsor Estates
- Hannah Plan at Windsor Village - Windsor Estates
- Alexandria Plan at Windsor Village - Windsor Estates
- Brady Plan at Windsor Village - Windsor Estates
- Winchester A Plan at Windsor Village - Windsor Estates
- Covington Plan at Windsor Village - Windsor Estates
- Bella Plan at Windsor Village - Windsor Estates
- Bristol Villa Plan at Windsor Village - Windsor Estates
- Winchester B Plan at Windsor Village - Windsor Estates
- Bristol Plan at Windsor Village - Windsor Estates
- Herndon Plan at Windsor Village - Windsor Estates
- Culpepper Plan at Windsor Village - Windsor Estates
- Titan Plan at Windsor Village - Windsor Estates
- Scarlett Plan at Windsor Village - Windsor Estates
- 552 Somerset Dr
- 4247 State Route 162
- 261 Emerald Way W