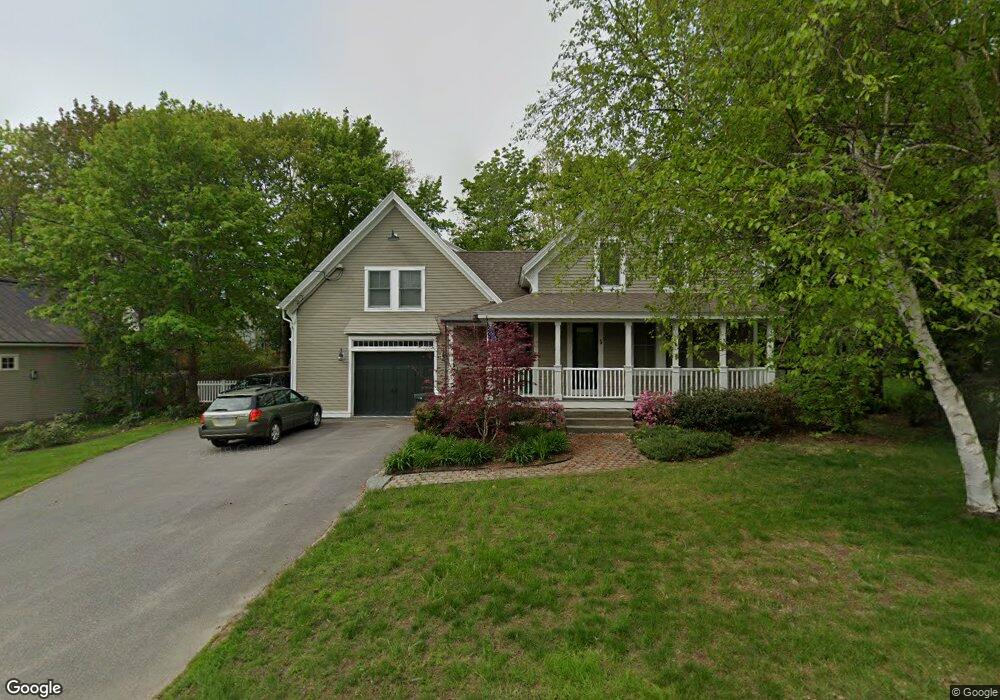
5 Harden Ave Camden, ME 04843
Estimated Value: $696,000 - $837,000
3
Beds
3
Baths
1,698
Sq Ft
$460/Sq Ft
Est. Value
About This Home
This home is located at 5 Harden Ave, Camden, ME 04843 and is currently estimated at $780,705, approximately $459 per square foot. 5 Harden Ave is a home located in Knox County with nearby schools including Camden-Rockport Elementary School, Camden-Rockport Middle School, and Camden Hills Regional High School.
Ownership History
Date
Name
Owned For
Owner Type
Purchase Details
Closed on
Jun 28, 2005
Sold by
Hayward Lynn S and Hayward Shirley J
Bought by
Schrum Jake B and Schrum Jane W
Current Estimated Value
Home Financials for this Owner
Home Financials are based on the most recent Mortgage that was taken out on this home.
Original Mortgage
$224,000
Outstanding Balance
$116,645
Interest Rate
5.82%
Mortgage Type
Purchase Money Mortgage
Estimated Equity
$664,060
Create a Home Valuation Report for This Property
The Home Valuation Report is an in-depth analysis detailing your home's value as well as a comparison with similar homes in the area
Home Values in the Area
Average Home Value in this Area
Purchase History
| Date | Buyer | Sale Price | Title Company |
|---|---|---|---|
| Schrum Jake B | -- | -- |
Source: Public Records
Mortgage History
| Date | Status | Borrower | Loan Amount |
|---|---|---|---|
| Open | Schrum Jake B | $224,000 | |
| Closed | Schrum Jake B | $42,000 |
Source: Public Records
Tax History Compared to Growth
Tax History
| Year | Tax Paid | Tax Assessment Tax Assessment Total Assessment is a certain percentage of the fair market value that is determined by local assessors to be the total taxable value of land and additions on the property. | Land | Improvement |
|---|---|---|---|---|
| 2024 | $7,237 | $689,200 | $247,300 | $441,900 |
| 2023 | $6,216 | $450,400 | $131,200 | $319,200 |
| 2022 | $5,945 | $450,400 | $131,200 | $319,200 |
| 2021 | $5,778 | $376,400 | $109,700 | $266,700 |
| 2020 | $5,657 | $376,400 | $109,700 | $266,700 |
| 2019 | $5,612 | $376,400 | $109,700 | $266,700 |
| 2018 | $5,523 | $371,200 | $137,100 | $234,100 |
| 2017 | $5,338 | $371,200 | $137,100 | $234,100 |
| 2016 | $3,935 | $252,400 | $71,400 | $181,000 |
| 2015 | $3,819 | $252,400 | $71,400 | $181,000 |
| 2014 | $3,642 | $252,400 | $71,400 | $181,000 |
| 2013 | $3,544 | $252,400 | $71,400 | $181,000 |
Source: Public Records
Map
Nearby Homes