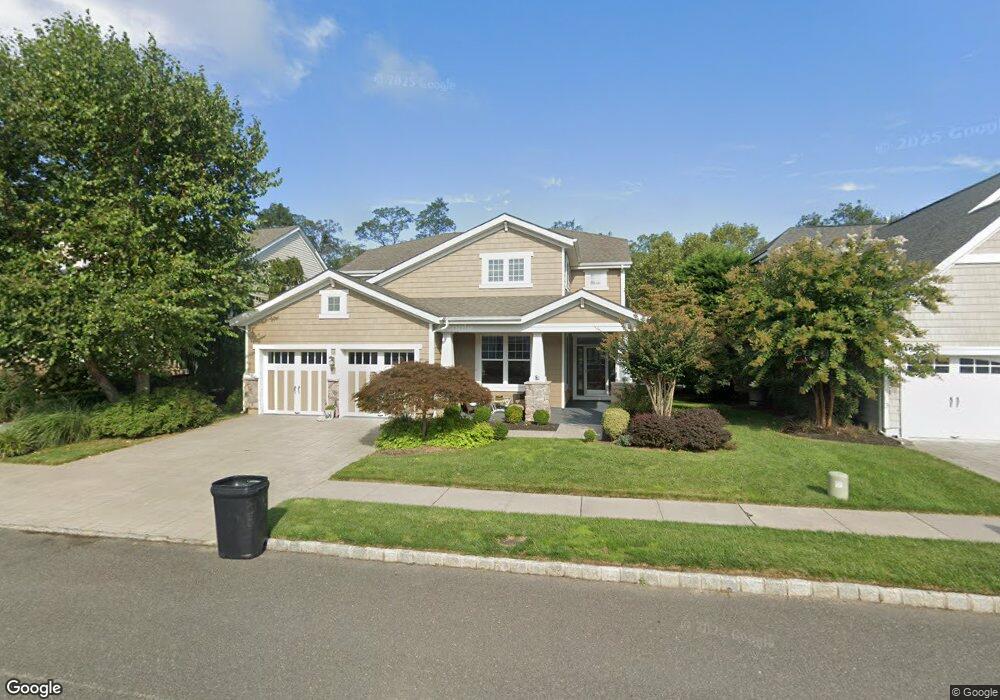
5 Haskell Way Oceanport, NJ 07757
Estimated Value: $1,014,000 - $1,438,000
3
Beds
2
Baths
3,450
Sq Ft
$363/Sq Ft
Est. Value
About This Home
This home is located at 5 Haskell Way, Oceanport, NJ 07757 and is currently estimated at $1,252,939, approximately $363 per square foot. 5 Haskell Way is a home located in Monmouth County with nearby schools including Wolf Hill Elementary School, Maple Place Elementary and Middle School, and Shore Regional High School.
Ownership History
Date
Name
Owned For
Owner Type
Purchase Details
Closed on
May 22, 2015
Sold by
Heiss Jeffrey D and Heiss Kathleen E
Bought by
The Jeffrey D Heiss And Kathleen E Heiss
Current Estimated Value
Purchase Details
Closed on
Apr 23, 2009
Sold by
K Hovnanian At Oceanport Llc
Bought by
Heiss Jeffrey D and Heiss Kathleen E
Home Financials for this Owner
Home Financials are based on the most recent Mortgage that was taken out on this home.
Original Mortgage
$600,000
Outstanding Balance
$396,673
Interest Rate
4.93%
Mortgage Type
Purchase Money Mortgage
Create a Home Valuation Report for This Property
The Home Valuation Report is an in-depth analysis detailing your home's value as well as a comparison with similar homes in the area
Home Values in the Area
Average Home Value in this Area
Purchase History
Date | Buyer | Sale Price | Title Company |
---|---|---|---|
The Jeffrey D Heiss And Kathleen E Heiss | -- | Attorney | |
Heiss Jeffrey D | $758,728 | Eastern Title Agency Inc |
Source: Public Records
Mortgage History
Date | Status | Borrower | Loan Amount |
---|---|---|---|
Open | Heiss Jeffrey D | $600,000 |
Source: Public Records
Tax History Compared to Growth
Tax History
Year | Tax Paid | Tax Assessment Tax Assessment Total Assessment is a certain percentage of the fair market value that is determined by local assessors to be the total taxable value of land and additions on the property. | Land | Improvement |
---|---|---|---|---|
2024 | $16,890 | $1,067,500 | $460,200 | $607,300 |
2023 | $16,890 | $1,015,000 | $431,400 | $583,600 |
2022 | $15,834 | $887,800 | $368,200 | $519,600 |
2021 | $15,834 | $831,200 | $331,400 | $499,800 |
2020 | $14,651 | $801,500 | $304,900 | $496,600 |
2019 | $14,219 | $789,500 | $304,900 | $484,600 |
2018 | $14,113 | $788,900 | $304,900 | $484,000 |
2017 | $13,941 | $646,300 | $225,200 | $421,100 |
2016 | $13,782 | $643,100 | $225,200 | $417,900 |
2015 | $13,114 | $632,300 | $225,200 | $407,100 |
2014 | $12,337 | $603,300 | $225,200 | $378,100 |
Source: Public Records
Map
Nearby Homes