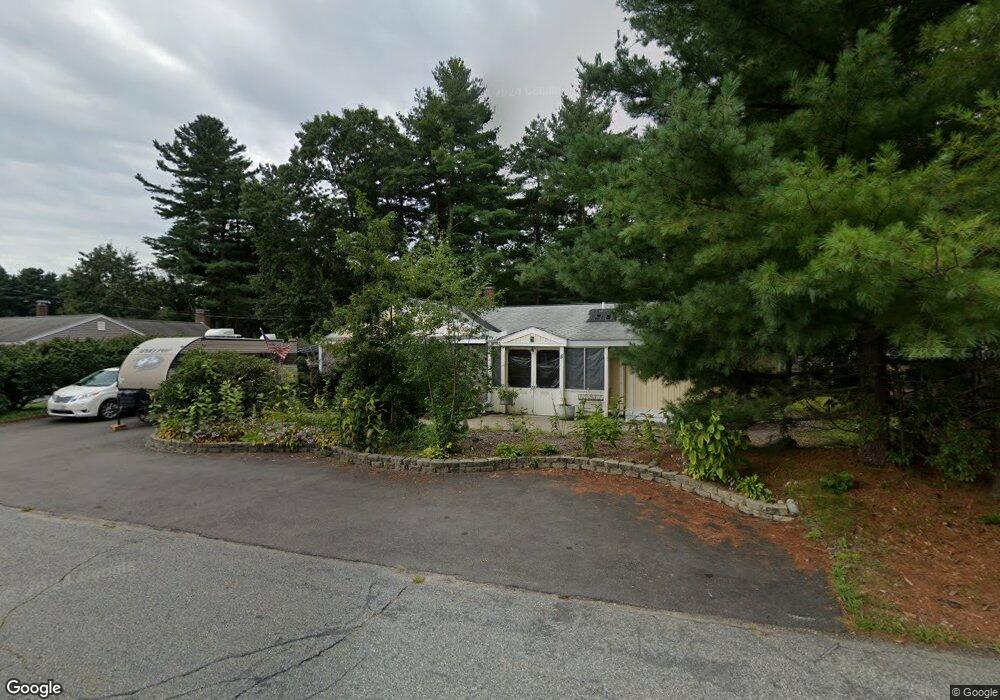
5 Haynes St Walpole, MA 02081
Estimated Value: $588,000 - $705,000
3
Beds
2
Baths
1,461
Sq Ft
$435/Sq Ft
Est. Value
About This Home
This home is located at 5 Haynes St, Walpole, MA 02081 and is currently estimated at $635,599, approximately $435 per square foot. 5 Haynes St is a home located in Norfolk County with nearby schools including Elm Street School, Eleanor N. Johnson Middle School, and Walpole High School.
Ownership History
Date
Name
Owned For
Owner Type
Purchase Details
Closed on
Apr 30, 2021
Sold by
Annati Mark and Annati Mary
Bought by
M A & M M Annati Lt
Current Estimated Value
Purchase Details
Closed on
Aug 9, 1996
Sold by
Hamlin Andrew B
Bought by
Annati Mark and Annati Mary
Home Financials for this Owner
Home Financials are based on the most recent Mortgage that was taken out on this home.
Original Mortgage
$1,024
Interest Rate
8.24%
Mortgage Type
Purchase Money Mortgage
Purchase Details
Closed on
Jul 13, 1989
Sold by
Mulvehill John E
Bought by
Hamlin Andrew B
Home Financials for this Owner
Home Financials are based on the most recent Mortgage that was taken out on this home.
Original Mortgage
$106,200
Interest Rate
10.39%
Mortgage Type
Purchase Money Mortgage
Create a Home Valuation Report for This Property
The Home Valuation Report is an in-depth analysis detailing your home's value as well as a comparison with similar homes in the area
Home Values in the Area
Average Home Value in this Area
Purchase History
| Date | Buyer | Sale Price | Title Company |
|---|---|---|---|
| M A & M M Annati Lt | -- | None Available | |
| Annati Mark | $134,000 | -- | |
| Hamlin Andrew B | $118,000 | -- |
Source: Public Records
Mortgage History
| Date | Status | Borrower | Loan Amount |
|---|---|---|---|
| Previous Owner | Hamlin Andrew B | $131,000 | |
| Previous Owner | Hamlin Andrew B | $1,024 | |
| Previous Owner | Hamlin Andrew B | $106,200 |
Source: Public Records
Tax History Compared to Growth
Tax History
| Year | Tax Paid | Tax Assessment Tax Assessment Total Assessment is a certain percentage of the fair market value that is determined by local assessors to be the total taxable value of land and additions on the property. | Land | Improvement |
|---|---|---|---|---|
| 2025 | $6,767 | $527,400 | $276,500 | $250,900 |
| 2024 | $6,524 | $493,500 | $265,800 | $227,700 |
| 2023 | $6,355 | $457,500 | $231,100 | $226,400 |
| 2022 | $6,010 | $415,600 | $214,000 | $201,600 |
| 2021 | $5,654 | $381,000 | $201,900 | $179,100 |
| 2020 | $5,482 | $365,700 | $180,500 | $185,200 |
| 2019 | $5,330 | $353,000 | $173,600 | $179,400 |
| 2018 | $4,576 | $299,700 | $158,000 | $141,700 |
| 2017 | $4,440 | $289,600 | $151,900 | $137,700 |
| 2016 | $4,525 | $290,800 | $154,600 | $136,200 |
| 2015 | $4,150 | $264,300 | $130,800 | $133,500 |
| 2014 | $3,929 | $249,300 | $130,800 | $118,500 |
Source: Public Records
Map
Nearby Homes
- 21 Spear Ave
- 634 Main St Unit 14
- 2213 Pennington Dr Unit 2213
- 4403 Pennington Dr Unit 4403
- 224 School St Unit 10
- 291 Plimpton St
- 66 Gould St
- 12 Dutton Park
- 19 and 23 Arlington Ln
- 103 Centre Ln
- 305 Centre Ln
- 24 Pelican Dr
- 18 Teal Cir
- 4 Lost Brook Trail
- 8 Autumn Ln
- 8 Rainbow Pond Dr Unit 8
- 137 Clear Pond Dr
- 127 Clear Pond Dr
- 12 Timberline Dr Unit 28
- 16 Magpie Cir Unit 16