Estimated Value: $784,000 - $925,000
4
Beds
2
Baths
1,900
Sq Ft
$439/Sq Ft
Est. Value
About This Home
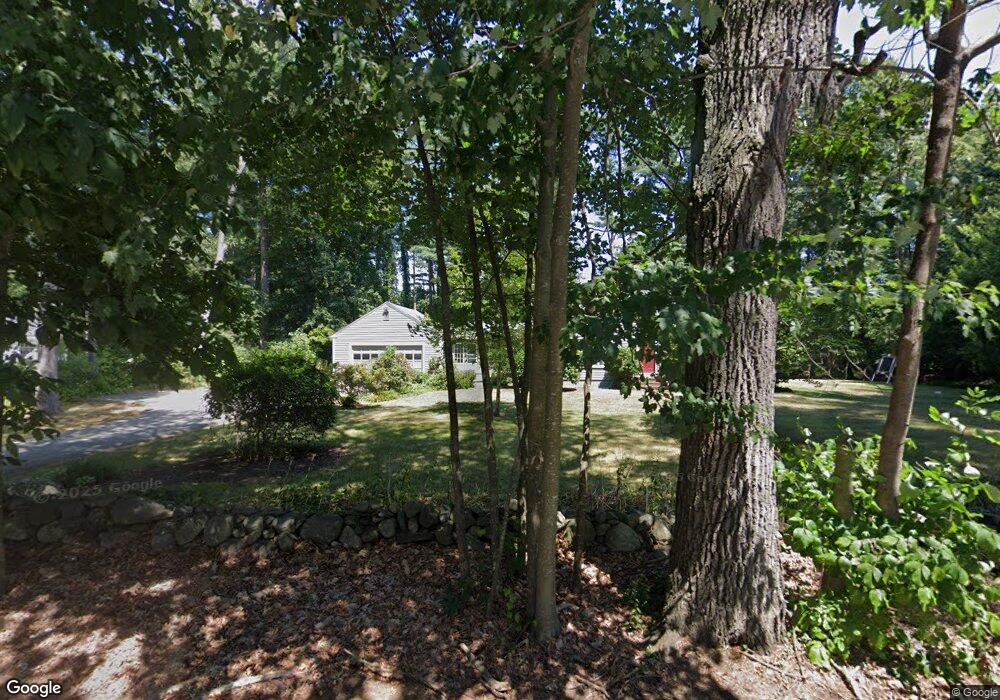
This home is located at 5 Hayward Rd, Acton, MA 01720 and is currently estimated at $833,681, approximately $438 per square foot. 5 Hayward Rd is a home located in Middlesex County with nearby schools including Acton-Boxborough Regional High School, Maynard Knowledge Beginnings, and The Imago School.
Ownership History
Date
Name
Owned For
Owner Type
Purchase Details
Closed on
Jun 9, 2006
Sold by
Flaherty Dennis M and Burton Eve Nicole
Bought by
Keene David M and Kobrenski Shelley M
Current Estimated Value
Purchase Details
Closed on
Dec 17, 2001
Sold by
Fitzgerald Anne S and Landers John G
Bought by
Burton Eve Nicole and Flaherty Dennis M
Purchase Details
Closed on
Jan 27, 1988
Sold by
Tuomanen Robert W
Bought by
Fitzgerald Anne S
Create a Home Valuation Report for This Property
The Home Valuation Report is an in-depth analysis detailing your home's value as well as a comparison with similar homes in the area
Home Values in the Area
Average Home Value in this Area
Purchase History
| Date | Buyer | Sale Price | Title Company |
|---|---|---|---|
| Keene David M | $478,500 | -- | |
| Keene David M | $478,500 | -- | |
| Burton Eve Nicole | $365,900 | -- | |
| Fitzgerald Anne S | $235,000 | -- |
Source: Public Records
Mortgage History
| Date | Status | Borrower | Loan Amount |
|---|---|---|---|
| Open | Fitzgerald Anne S | $27,000 | |
| Open | Fitzgerald Anne S | $374,000 |
Source: Public Records
Tax History
| Year | Tax Paid | Tax Assessment Tax Assessment Total Assessment is a certain percentage of the fair market value that is determined by local assessors to be the total taxable value of land and additions on the property. | Land | Improvement |
|---|---|---|---|---|
| 2025 | $11,118 | $648,300 | $285,500 | $362,800 |
| 2024 | $10,500 | $629,900 | $285,500 | $344,400 |
| 2023 | $10,794 | $614,700 | $259,400 | $355,300 |
| 2022 | $9,743 | $500,900 | $225,600 | $275,300 |
| 2021 | $9,409 | $465,100 | $208,800 | $256,300 |
| 2020 | $8,691 | $451,700 | $208,800 | $242,900 |
| 2019 | $8,350 | $431,100 | $208,800 | $222,300 |
| 2018 | $8,205 | $423,400 | $208,800 | $214,600 |
| 2017 | $8,198 | $430,100 | $208,800 | $221,300 |
| 2016 | $7,779 | $404,500 | $208,800 | $195,700 |
| 2015 | $7,706 | $404,500 | $208,800 | $195,700 |
| 2014 | $7,523 | $386,800 | $208,800 | $178,000 |
Source: Public Records
Map
Nearby Homes
- 18 Hayward Rd
- 11 Braebrook
- 46 Taylor Rd
- 491 Main St
- 33 Meadowbrook Rd
- 27 Forest Rd
- 79 Charter Rd
- 246 Main St Unit 2
- 7 Kelley Rd
- 709 Main St
- 524 Main St
- 25 Nylander Way
- 235 Arlington St
- 70 River St
- 187 Great Rd Unit A1
- 7 Hillcrest Dr
- 129 Main St Unit 129
- 131 Main St
- 8 Algonquin Rd
- 285 Central St Unit 285
Your Personal Tour Guide
Ask me questions while you tour the home.