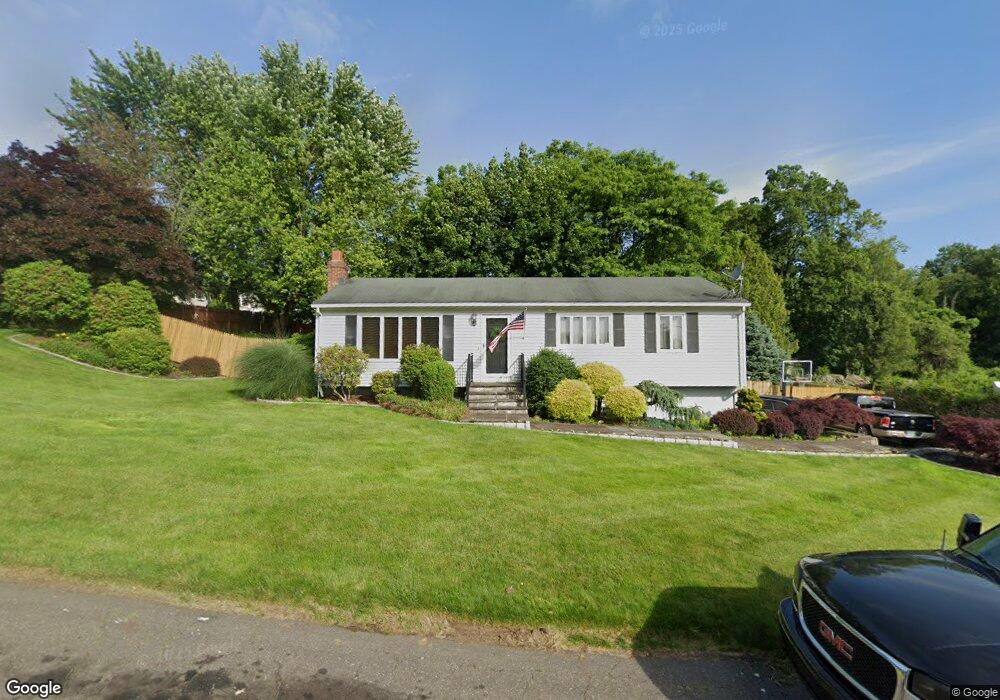
5 Hemlock Rd Seymour, CT 06483
Estimated Value: $396,339 - $450,000
3
Beds
3
Baths
1,150
Sq Ft
$365/Sq Ft
Est. Value
About This Home
This home is located at 5 Hemlock Rd, Seymour, CT 06483 and is currently estimated at $419,585, approximately $364 per square foot. 5 Hemlock Rd is a home located in New Haven County with nearby schools including Bungay Elementary School, Seymour Middle School, and Seymour High School.
Ownership History
Date
Name
Owned For
Owner Type
Purchase Details
Closed on
Dec 20, 2010
Sold by
Moramarco Jack A and Moramarco Jennifer M
Bought by
Countrywide Home Loans
Current Estimated Value
Purchase Details
Closed on
Apr 28, 2006
Sold by
Bosco Jacqueline
Bought by
Chamberland Sean and Chamberland Nicki
Home Financials for this Owner
Home Financials are based on the most recent Mortgage that was taken out on this home.
Original Mortgage
$25,000
Interest Rate
6.62%
Purchase Details
Closed on
Mar 23, 2005
Sold by
Tottenham Patrick J and Tottenham Christy
Bought by
Moramarco Jack A and Moramarco Jennifer M
Purchase Details
Closed on
Sep 18, 1990
Sold by
Janicki Steven
Bought by
Tottenham Patrick
Purchase Details
Closed on
Nov 2, 1987
Sold by
Chahil Kiran
Bought by
Janicki Steven
Create a Home Valuation Report for This Property
The Home Valuation Report is an in-depth analysis detailing your home's value as well as a comparison with similar homes in the area
Home Values in the Area
Average Home Value in this Area
Purchase History
| Date | Buyer | Sale Price | Title Company |
|---|---|---|---|
| Countrywide Home Loans | -- | -- | |
| Chamberland Sean | $300,000 | -- | |
| Moramarco Jack A | $280,000 | -- | |
| Tottenham Patrick | $163,000 | -- | |
| Janicki Steven | $165,000 | -- |
Source: Public Records
Mortgage History
| Date | Status | Borrower | Loan Amount |
|---|---|---|---|
| Open | Janicki Steven | $29,680 | |
| Previous Owner | Janicki Steven | $25,000 |
Source: Public Records
Tax History Compared to Growth
Tax History
| Year | Tax Paid | Tax Assessment Tax Assessment Total Assessment is a certain percentage of the fair market value that is determined by local assessors to be the total taxable value of land and additions on the property. | Land | Improvement |
|---|---|---|---|---|
| 2025 | $6,085 | $219,520 | $45,360 | $174,160 |
| 2024 | $5,426 | $147,280 | $36,260 | $111,020 |
| 2023 | $5,299 | $147,280 | $36,260 | $111,020 |
| 2022 | $5,242 | $147,280 | $36,260 | $111,020 |
| 2021 | $5,112 | $147,280 | $36,260 | $111,020 |
| 2020 | $4,927 | $136,850 | $42,630 | $94,220 |
| 2019 | $4,927 | $136,850 | $42,630 | $94,220 |
| 2018 | $4,927 | $136,850 | $42,630 | $94,220 |
| 2017 | $4,927 | $136,850 | $42,630 | $94,220 |
| 2016 | $4,927 | $136,850 | $42,630 | $94,220 |
| 2015 | $5,073 | $146,650 | $44,870 | $101,780 |
| 2014 | $4,992 | $146,650 | $44,870 | $101,780 |
Source: Public Records
Map
Nearby Homes
- 36 Bungay Terrace
- 4 Nickel Mine Dr
- 37-14, 49-1, 79-2, 7 Balance Rock Rd
- 4 Mead Farm Rd
- 50 Bissell Place
- 114 Balance Rock Rd Unit 12
- 26 Balance Rock Rd Unit 16
- 3 Deer Run Dr
- 41 Balance Rock Rd Unit 16
- 43 Balance Rock Rd Unit 9
- 202 W Church St
- 139 Derby Ave
- 28 Brook St
- 3 Hine St
- 77 S Main St
- 4 Brook St
- 26-28 S Main St
- 9 Wooster St
- 73 Botsford Rd
- 11 Oxford Rd