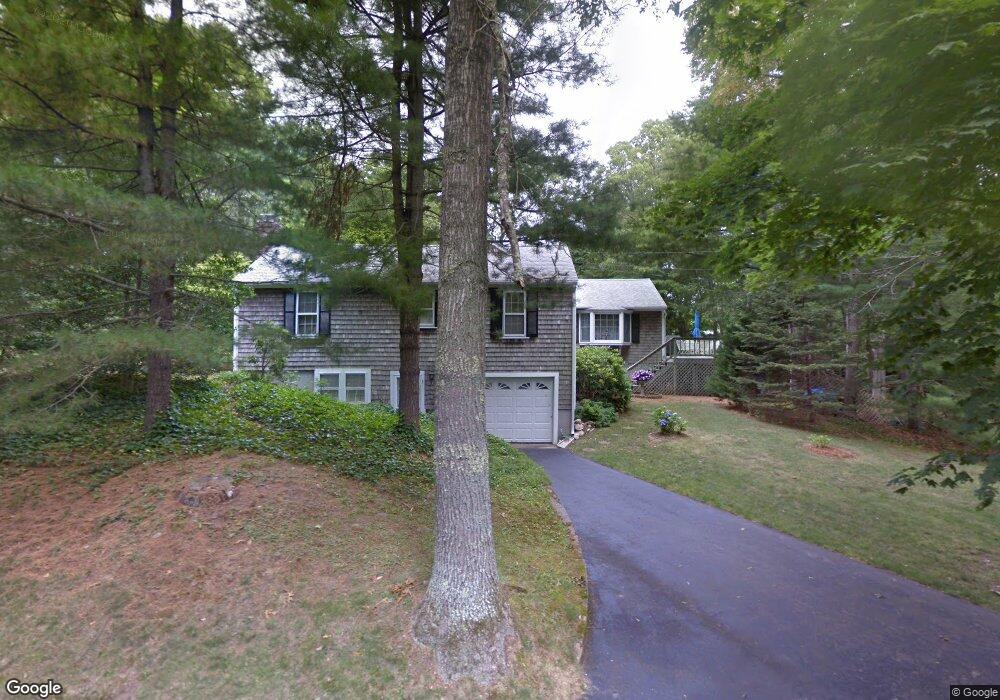
5 Hinckley Cir Osterville, MA 02655
Osterville NeighborhoodEstimated Value: $831,000 - $950,866
2
Beds
3
Baths
1,418
Sq Ft
$621/Sq Ft
Est. Value
About This Home
This home is located at 5 Hinckley Cir, Osterville, MA 02655 and is currently estimated at $880,217, approximately $620 per square foot. 5 Hinckley Cir is a home located in Barnstable County with nearby schools including Barnstable United Elementary School, West Villages Elementary School, and Barnstable Intermediate School.
Ownership History
Date
Name
Owned For
Owner Type
Purchase Details
Closed on
Jun 28, 2016
Sold by
Reed Paul C
Bought by
Hinckley Rt and Reed
Current Estimated Value
Purchase Details
Closed on
Aug 26, 2014
Sold by
Hinckley David L and Hinckley Theresa G
Bought by
Hinckley David L and Hinckley Theresa G
Create a Home Valuation Report for This Property
The Home Valuation Report is an in-depth analysis detailing your home's value as well as a comparison with similar homes in the area
Home Values in the Area
Average Home Value in this Area
Purchase History
| Date | Buyer | Sale Price | Title Company |
|---|---|---|---|
| Hinckley Rt | -- | -- | |
| Reed Paul C | -- | -- | |
| Hinckley David L | -- | -- | |
| Reed Paul C | -- | -- | |
| Hinckley David L | -- | -- |
Source: Public Records
Tax History
| Year | Tax Paid | Tax Assessment Tax Assessment Total Assessment is a certain percentage of the fair market value that is determined by local assessors to be the total taxable value of land and additions on the property. | Land | Improvement |
|---|---|---|---|---|
| 2025 | $6,347 | $784,600 | $347,500 | $437,100 |
| 2024 | $6,097 | $780,700 | $347,500 | $433,200 |
| 2023 | $5,809 | $696,500 | $323,100 | $373,400 |
| 2022 | $5,302 | $550,000 | $223,400 | $326,600 |
| 2021 | $5,358 | $510,800 | $244,700 | $266,100 |
| 2020 | $5,583 | $509,400 | $244,700 | $264,700 |
| 2019 | $5,506 | $488,100 | $255,300 | $232,800 |
| 2018 | $5,097 | $454,300 | $257,600 | $196,700 |
| 2017 | $4,713 | $438,000 | $257,600 | $180,400 |
| 2016 | $4,787 | $439,200 | $258,800 | $180,400 |
| 2015 | $4,643 | $427,900 | $253,700 | $174,200 |
Source: Public Records
Map
Nearby Homes
- 29 Oak Ridge Rd
- 77 Robbins St
- 39 Tower Hill Rd Unit 1C
- 920 Main St Unit 1 Building 2
- 920 Main St Unit 2-1
- 39 Blossom Ave Unit 4
- 33 Sunset Ln
- 30 Pond St
- 40 Waterfield Rd
- 117 Parsley Ln
- 67 Fire Station Rd
- 16 2nd Ave Unit 4
- 16 2nd Ave Unit 5A
- 146 Scudder Rd
- 89 Swift Ave
- 51 Wianno Cir
- 351 Swift Ave
- 369 Bumps River Rd
- 98 Bunker Hill Rd
- 818 S Main St
Your Personal Tour Guide
Ask me questions while you tour the home.