
5 Hodges Ct Unit 2 Salem, MA 01970
Derby Street Neighborhood
2
Beds
1
Bath
900
Sq Ft
$150/mo
HOA Fee
Highlights
- Marina
- Property is near public transit
- Solid Surface Countertops
- Waterfront
- Wood Flooring
- 3-minute walk to Derby Garden
About This Home
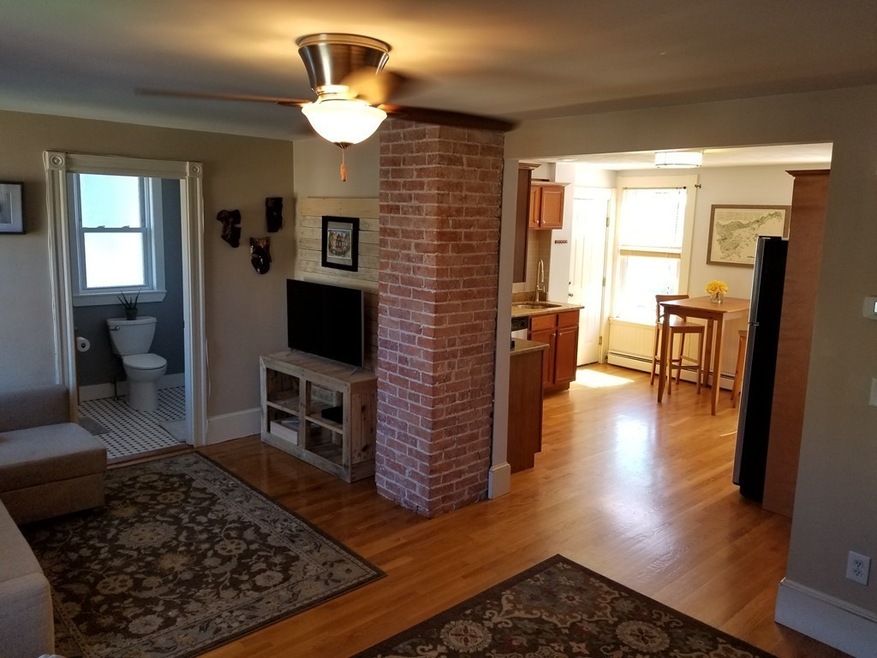
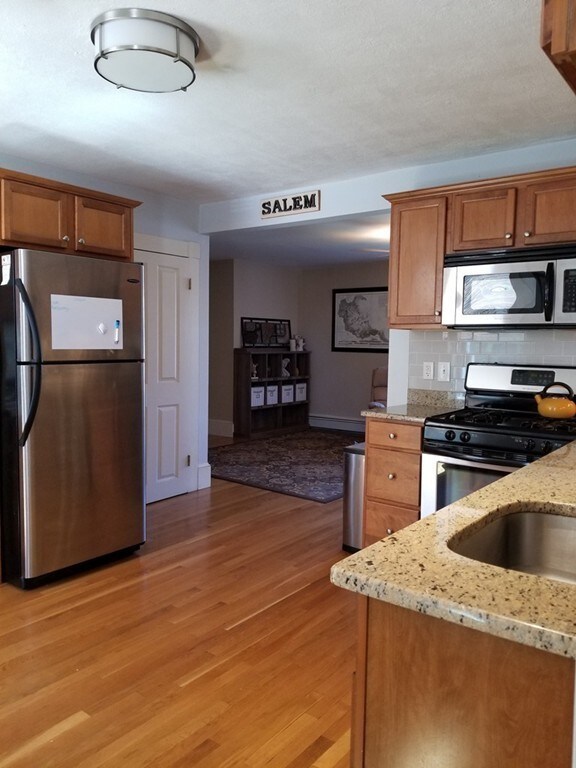
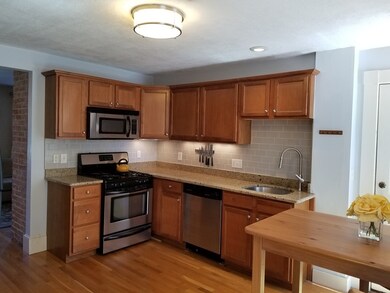
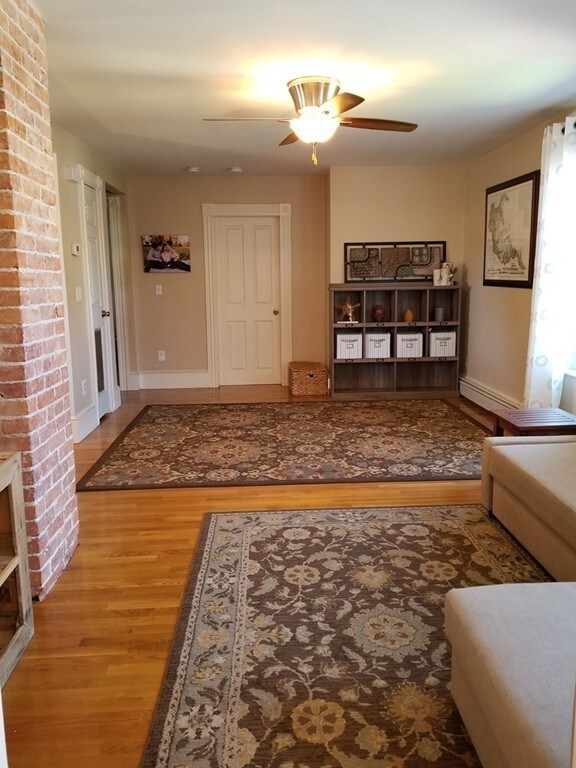
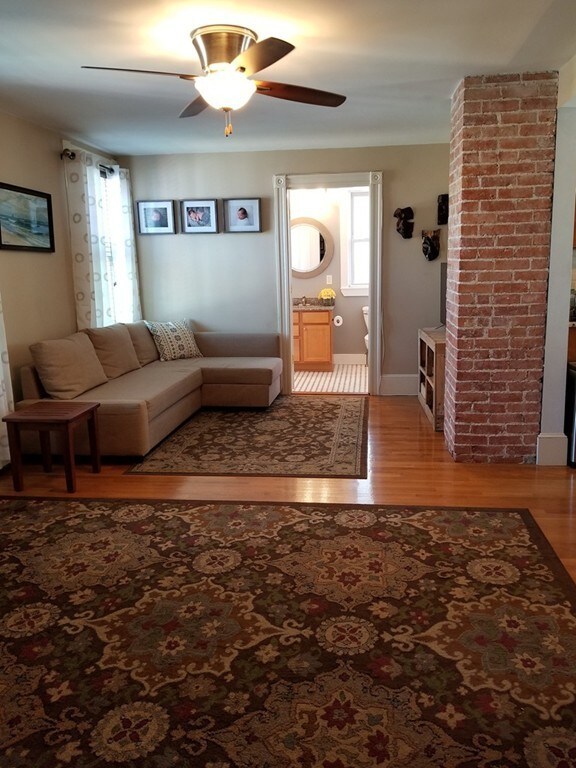
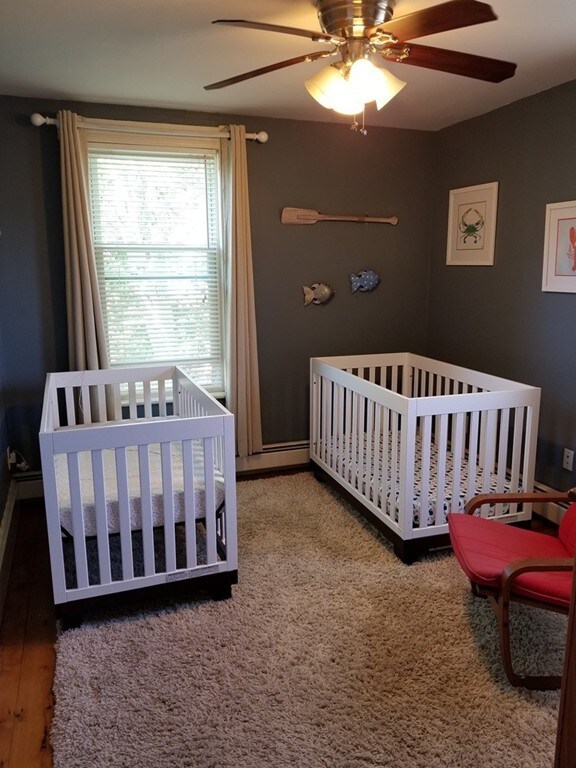
As of August 2018Welcome home to Renaissance Condos at Hodges Court. This lovely two bedroom unit in the heart of Salem is a short walk to Pickering Wharf, Salem Common, great restaurants and breweries, the commuter rail and ferry to Boston. A rare find with two car off street parking on a quiet one way street. Second floor unit features a large open living room, eat-in kitchen with stainless appliances, new backsplash and upgraded fixtures. A bright master bedroom with his and her closets, in-unit laundry, linen closet, hardwood floors and private outdoor porch make this unit live large. Additional basement space for office/workshop or storage. Pet friendly three unit association with great neighbors. This efficient condo has the lowest fee around and is not to be missed!
Property Details
Home Type
- Condominium
Est. Annual Taxes
- $3,704
Year Built
- Built in 1890
Lot Details
- Waterfront
- Two or More Common Walls
HOA Fees
- $150 Monthly HOA Fees
Home Design
- Garden Home
- Frame Construction
- Shingle Roof
Interior Spaces
- 900 Sq Ft Home
- 3-Story Property
- Wood Flooring
Kitchen
- Range
- Dishwasher
- Solid Surface Countertops
- Disposal
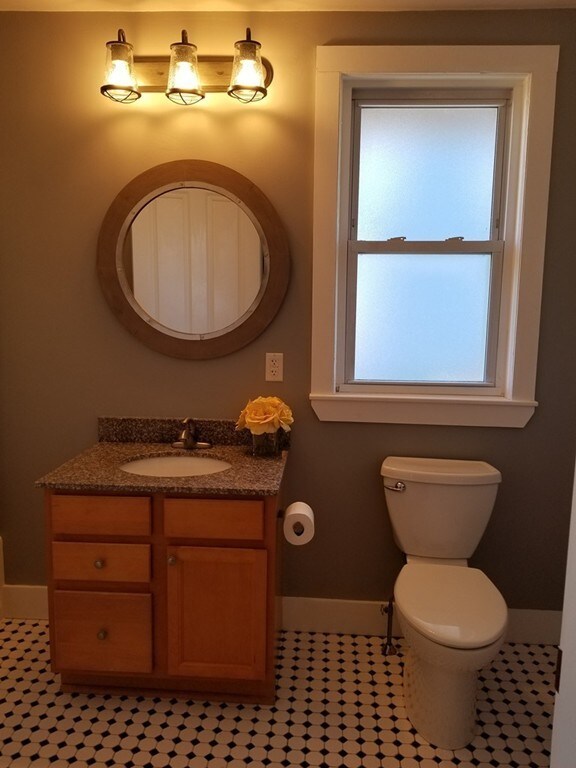
Bedrooms and Bathrooms
- 2 Bedrooms
- 1 Full Bathroom
Laundry
- Laundry in unit
- Dryer
- Washer
Parking
- 2 Car Parking Spaces
- Off-Street Parking
Utilities
- No Cooling
- 1 Heating Zone
- Heating System Uses Natural Gas
- Baseboard Heating
Additional Features
- Porch
- Property is near public transit
Listing and Financial Details
- Assessor Parcel Number M:35 L:0335 S:802,4647223
Community Details
Overview
- Association fees include water, insurance
- 3 Units
- Renaissance Condominiums Community
Recreation
- Marina
- Park
Pet Policy
- Pets Allowed
Ownership History
Date
Name
Owned For
Owner Type
Purchase Details
Listed on
Jul 9, 2018
Closed on
Aug 30, 2018
Sold by
Bryan Katelyn and Latouf William G
Bought by
Flavell April E
Seller's Agent
Bill Cerrato
StartPoint Realty
Buyer's Agent
Diane Polley
Churchill Properties
List Price
$299,900
Sold Price
$330,000
Premium/Discount to List
$30,100
10.04%
Current Estimated Value
Home Financials for this Owner
Home Financials are based on the most recent Mortgage that was taken out on this home.
Estimated Appreciation
$147,094
Avg. Annual Appreciation
5.40%
Original Mortgage
$313,500
Interest Rate
4.5%
Mortgage Type
New Conventional
Purchase Details
Listed on
May 31, 2015
Closed on
Sep 10, 2015
Sold by
Crotty Amy
Bought by
Latouf William G and Bryan Katelyn
Seller's Agent
DANIEL DEMERS
Sell Your Home Services
Buyer's Agent
Bill Cerrato
StartPoint Realty
List Price
$249,999
Sold Price
$225,000
Premium/Discount to List
-$24,999
-10%
Home Financials for this Owner
Home Financials are based on the most recent Mortgage that was taken out on this home.
Avg. Annual Appreciation
13.76%
Original Mortgage
$180,000
Interest Rate
4.01%
Mortgage Type
New Conventional
Purchase Details
Closed on
Oct 13, 2006
Sold by
Hodges Court Re Llc
Bought by
Sheeran Patrick J
Home Financials for this Owner
Home Financials are based on the most recent Mortgage that was taken out on this home.
Original Mortgage
$215,200
Interest Rate
6.47%
Mortgage Type
Purchase Money Mortgage
Similar Homes in Salem, MA
Create a Home Valuation Report for This Property
The Home Valuation Report is an in-depth analysis detailing your home's value as well as a comparison with similar homes in the area
Home Values in the Area
Average Home Value in this Area
Purchase History
| Date | Type | Sale Price | Title Company |
|---|---|---|---|
| Deed | $330,000 | -- | |
| Not Resolvable | $225,000 | -- | |
| Deed | $269,000 | -- |
Source: Public Records
Mortgage History
| Date | Status | Loan Amount | Loan Type |
|---|---|---|---|
| Open | $307,000 | Stand Alone Refi Refinance Of Original Loan | |
| Closed | $313,500 | New Conventional | |
| Previous Owner | $179,000 | Unknown | |
| Previous Owner | $180,000 | New Conventional | |
| Previous Owner | $253,600 | No Value Available | |
| Previous Owner | $266,000 | No Value Available | |
| Previous Owner | $215,200 | Purchase Money Mortgage | |
| Previous Owner | $53,800 | No Value Available |
Source: Public Records
Property History
| Date | Event | Price | Change | Sq Ft Price |
|---|---|---|---|---|
| 02/15/2021 02/15/21 | Rented | $2,100 | 0.0% | -- |
| 02/09/2021 02/09/21 | Under Contract | -- | -- | -- |
| 02/05/2021 02/05/21 | For Rent | $2,100 | 0.0% | -- |
| 08/30/2018 08/30/18 | Sold | $330,000 | +10.0% | $367 / Sq Ft |
| 07/17/2018 07/17/18 | Pending | -- | -- | -- |
| 07/09/2018 07/09/18 | For Sale | $299,900 | +33.3% | $333 / Sq Ft |
| 09/10/2015 09/10/15 | Sold | $225,000 | -4.2% | $250 / Sq Ft |
| 07/24/2015 07/24/15 | Pending | -- | -- | -- |
| 07/14/2015 07/14/15 | Price Changed | $234,900 | -4.1% | $261 / Sq Ft |
| 06/16/2015 06/16/15 | Price Changed | $244,999 | -2.0% | $272 / Sq Ft |
| 05/31/2015 05/31/15 | For Sale | $249,999 | +19.6% | $278 / Sq Ft |
| 05/11/2012 05/11/12 | Sold | $209,000 | 0.0% | $232 / Sq Ft |
| 05/06/2012 05/06/12 | Pending | -- | -- | -- |
| 03/19/2012 03/19/12 | For Sale | $209,000 | -- | $232 / Sq Ft |
Source: MLS Property Information Network (MLS PIN)
Tax History Compared to Growth
Tax History
| Year | Tax Paid | Tax Assessment Tax Assessment Total Assessment is a certain percentage of the fair market value that is determined by local assessors to be the total taxable value of land and additions on the property. | Land | Improvement |
|---|---|---|---|---|
| 2025 | $4,967 | $438,000 | $0 | $438,000 |
| 2024 | $4,865 | $418,700 | $0 | $418,700 |
| 2023 | $4,730 | $378,100 | $0 | $378,100 |
| 2022 | $4,578 | $345,500 | $0 | $345,500 |
| 2021 | $4,504 | $326,400 | $0 | $326,400 |
| 2020 | $4,409 | $305,100 | $0 | $305,100 |
| 2019 | $3,997 | $264,700 | $0 | $264,700 |
| 2018 | $3,704 | $240,800 | $0 | $240,800 |
| 2017 | $3,630 | $228,900 | $0 | $228,900 |
| 2016 | $3,435 | $219,200 | $0 | $219,200 |
| 2015 | $3,438 | $209,500 | $0 | $209,500 |
Source: Public Records
Agents Affiliated with this Home
-
Julie Andrews
Seller's Agent in 2021
Julie Andrews
Keller Williams Realty Evolution
(978) 290-1495
3 in this area
37 Total Sales
-
Bill Cerrato
B
Seller's Agent in 2018
Bill Cerrato
StartPoint Realty
(774) 232-1085
7 Total Sales
-
Diane Polley
Buyer's Agent in 2018
Diane Polley
Churchill Properties
(508) 641-5535
9 Total Sales
-
DANIEL DEMERS
D
Seller's Agent in 2015
DANIEL DEMERS
Sell Your Home Services
(877) 893-6566
4,476 Total Sales
-
Thomas Beauregard
Seller's Agent in 2012
Thomas Beauregard
Keller Williams Realty Evolution
(781) 690-3837
32 Total Sales
-
Jennifer Sullivan
Buyer's Agent in 2012
Jennifer Sullivan
Keller Williams Realty Evolution
(978) 836-1175
33 Total Sales
Map
Source: MLS Property Information Network (MLS PIN)
MLS Number: 72358142
APN: SALE-000035-000000-000335-000802-000802
Disclaimer: Certain information contained herein is derived from information provided by parties other than Homes.com. All information provided is deemed reliable, but is not guaranteed to be accurate and should be independently verified.
![]() The property listing data and information, or the Images, set forth herein were provided to MLS Property Information Network, Inc. from third party sources, including sellers, lessors and public records, and were compiled by MLS Property Information Network, Inc. The property listing data and information, and the Images, are for the personal, non-commercial use of consumers having a good faith interest in purchasing or leasing listed properties of the type displayed to them and may not be used for any purpose other than to identify prospective properties which such consumers may have a good faith interest in purchasing or leasing. MLS Property Information Network, Inc. and its subscribers disclaim any and all representations and warranties as to the accuracy of the property listing data and information, or as to the accuracy of any of the Images, set forth herein.
The property listing data and information, or the Images, set forth herein were provided to MLS Property Information Network, Inc. from third party sources, including sellers, lessors and public records, and were compiled by MLS Property Information Network, Inc. The property listing data and information, and the Images, are for the personal, non-commercial use of consumers having a good faith interest in purchasing or leasing listed properties of the type displayed to them and may not be used for any purpose other than to identify prospective properties which such consumers may have a good faith interest in purchasing or leasing. MLS Property Information Network, Inc. and its subscribers disclaim any and all representations and warranties as to the accuracy of the property listing data and information, or as to the accuracy of any of the Images, set forth herein.
Nearby Homes
- 8-8.5 Herbert St
- 7 Curtis St Unit 1
- 81 Essex St Unit 1
- 67 Essex St Unit 2
- 67 Essex St Unit 1
- 225 Derby St Unit 608
- 131 Derby St Unit 3F
- 14 Forrester St Unit 2
- 48 Essex St Unit 7
- 4 Boardman St Unit 2
- 8 Briggs St
- 56 Peabody St Unit 2W
- 17 Central St Unit 10
- 26 Winter St
- 51 Lafayette St Unit 506
- 51 Lafayette St Unit 304
- 20 Central St Unit 405
- 20 Central St Unit 402
- 11 Church St Unit 109
- 11 Church St Unit 220