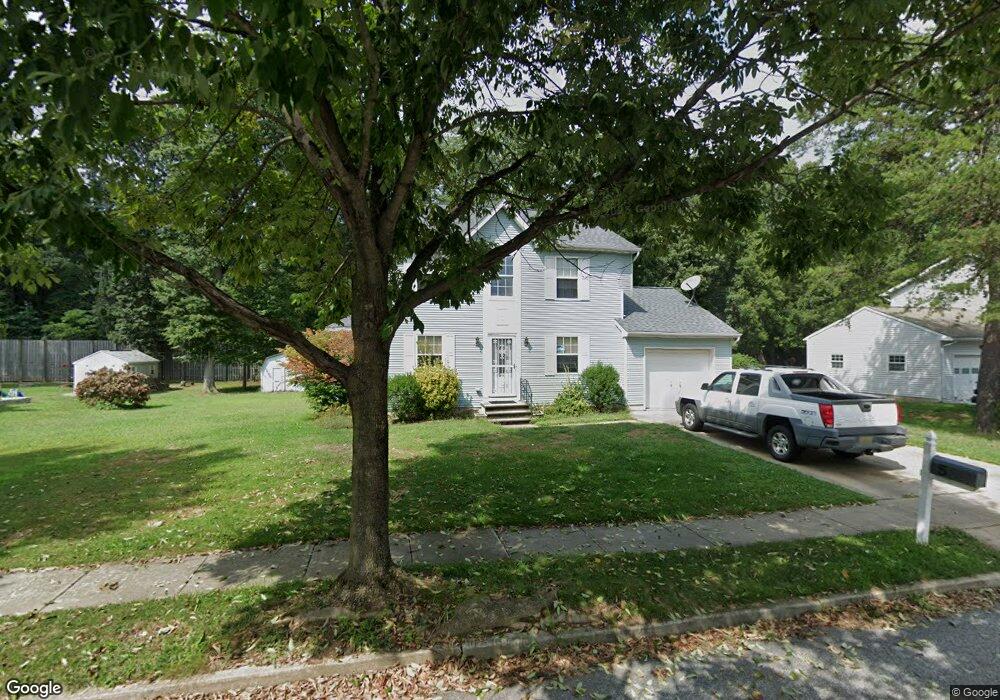
5 Hoffner Ct Roebling, NJ 08554
Estimated Value: $413,635 - $566,000
Studio
--
Bath
1,894
Sq Ft
$260/Sq Ft
Est. Value
About This Home
This home is located at 5 Hoffner Ct, Roebling, NJ 08554 and is currently estimated at $491,659, approximately $259 per square foot. 5 Hoffner Ct is a home located in Burlington County with nearby schools including Riverfront Middle School, Number 5, Roebling Elementary School, and Florence Twp Mem High School.
Ownership History
Date
Name
Owned For
Owner Type
Purchase Details
Closed on
Dec 11, 2002
Sold by
Bruno James G and Bruno Loretta
Bought by
Bruno James G
Current Estimated Value
Home Financials for this Owner
Home Financials are based on the most recent Mortgage that was taken out on this home.
Original Mortgage
$160,000
Outstanding Balance
$68,431
Interest Rate
6.18%
Estimated Equity
$423,228
Purchase Details
Closed on
Dec 28, 1994
Sold by
Keenan Development Company Llc
Bought by
Bruno James G and Bruno Loretta
Create a Home Valuation Report for This Property
The Home Valuation Report is an in-depth analysis detailing your home's value as well as a comparison with similar homes in the area
Home Values in the Area
Average Home Value in this Area
Purchase History
| Date | Buyer | Sale Price | Title Company |
|---|---|---|---|
| Bruno James G | -- | -- | |
| Bruno James G | $154,511 | Peoples Title Agency Inc | |
| Keenan Development Company Llc | -- | Peoples Title Agency Inc |
Source: Public Records
Mortgage History
| Date | Status | Borrower | Loan Amount |
|---|---|---|---|
| Open | Bruno James G | $160,000 |
Source: Public Records
Tax History
| Year | Tax Paid | Tax Assessment Tax Assessment Total Assessment is a certain percentage of the fair market value that is determined by local assessors to be the total taxable value of land and additions on the property. | Land | Improvement |
|---|---|---|---|---|
| 2025 | $7,949 | $285,200 | $96,000 | $189,200 |
| 2024 | $7,420 | $285,200 | $96,000 | $189,200 |
| 2023 | $7,420 | $278,100 | $96,000 | $182,100 |
| 2022 | $7,261 | $278,100 | $96,000 | $182,100 |
| 2021 | $7,197 | $278,100 | $96,000 | $182,100 |
| 2020 | $7,169 | $278,100 | $96,000 | $182,100 |
| 2019 | $7,105 | $278,100 | $96,000 | $182,100 |
| 2018 | $7,044 | $278,100 | $96,000 | $182,100 |
| 2017 | $6,958 | $278,100 | $96,000 | $182,100 |
| 2016 | $6,825 | $278,100 | $96,000 | $182,100 |
| 2015 | $6,686 | $278,100 | $96,000 | $182,100 |
| 2014 | $6,499 | $278,100 | $96,000 | $182,100 |
Source: Public Records
Map
Nearby Homes
Your Personal Tour Guide
Ask me questions while you tour the home.