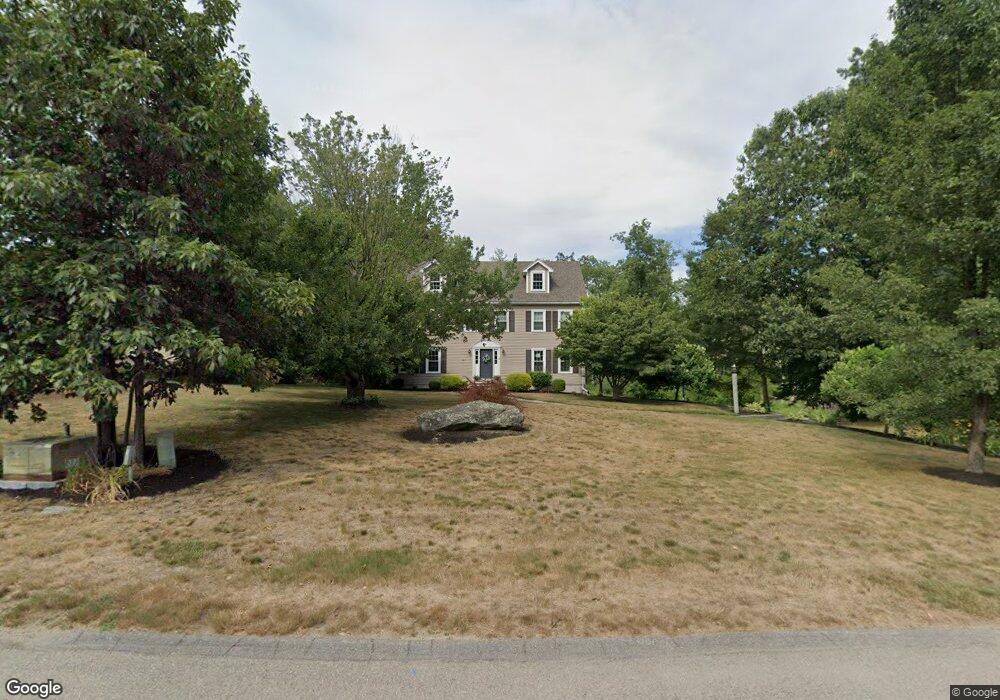
5 Holbrook St Medway, MA 02053
Estimated Value: $802,999 - $1,066,000
4
Beds
3
Baths
2,820
Sq Ft
$328/Sq Ft
Est. Value
About This Home
This home is located at 5 Holbrook St, Medway, MA 02053 and is currently estimated at $925,000, approximately $328 per square foot. 5 Holbrook St is a home located in Norfolk County with nearby schools including John D. McGovern Elementary School, Burke-Memorial Elementary, and Medway Middle School.
Ownership History
Date
Name
Owned For
Owner Type
Purchase Details
Closed on
Feb 23, 2001
Sold by
Fitzgerald Martin J and Fitzgerald Julia A
Bought by
Lorenzen David J and Lorenzen Robin P
Current Estimated Value
Home Financials for this Owner
Home Financials are based on the most recent Mortgage that was taken out on this home.
Original Mortgage
$275,000
Interest Rate
6.89%
Mortgage Type
Purchase Money Mortgage
Purchase Details
Closed on
Jul 1, 1993
Sold by
Ceijas Pedro I and Ceijas Bonnie L
Bought by
Fitzgerald Martin J and Fitzgerald Julia A
Home Financials for this Owner
Home Financials are based on the most recent Mortgage that was taken out on this home.
Original Mortgage
$224,900
Interest Rate
7.46%
Mortgage Type
Purchase Money Mortgage
Purchase Details
Closed on
Nov 6, 1990
Sold by
Ronica Rt
Bought by
Ceijas Pedro I
Create a Home Valuation Report for This Property
The Home Valuation Report is an in-depth analysis detailing your home's value as well as a comparison with similar homes in the area
Home Values in the Area
Average Home Value in this Area
Purchase History
| Date | Buyer | Sale Price | Title Company |
|---|---|---|---|
| Lorenzen David J | $344,900 | -- | |
| Fitzgerald Martin J | $249,900 | -- | |
| Ceijas Pedro I | $239,900 | -- |
Source: Public Records
Mortgage History
| Date | Status | Borrower | Loan Amount |
|---|---|---|---|
| Open | Ceijas Pedro I | $167,000 | |
| Closed | Ceijas Pedro I | $275,000 | |
| Previous Owner | Ceijas Pedro I | $240,000 | |
| Previous Owner | Ceijas Pedro I | $224,900 |
Source: Public Records
Tax History
| Year | Tax Paid | Tax Assessment Tax Assessment Total Assessment is a certain percentage of the fair market value that is determined by local assessors to be the total taxable value of land and additions on the property. | Land | Improvement |
|---|---|---|---|---|
| 2025 | $10,397 | $729,600 | $327,800 | $401,800 |
| 2024 | $10,506 | $729,600 | $327,800 | $401,800 |
| 2023 | $10,350 | $649,300 | $298,400 | $350,900 |
| 2022 | $8,738 | $516,100 | $220,600 | $295,500 |
| 2021 | $8,742 | $500,700 | $205,900 | $294,800 |
| 2020 | $8,558 | $489,000 | $205,900 | $283,100 |
| 2019 | $8,090 | $476,700 | $197,500 | $279,200 |
| 2018 | $8,147 | $461,300 | $189,100 | $272,200 |
| 2017 | $8,107 | $452,400 | $184,900 | $267,500 |
| 2016 | $7,927 | $437,700 | $170,200 | $267,500 |
| 2015 | $7,861 | $431,000 | $168,100 | $262,900 |
| 2014 | $7,579 | $402,300 | $168,100 | $234,200 |
Source: Public Records
Map
Nearby Homes
- 3 Millbrook Rd
- 22 Granite St
- 15 Fox Run Rd
- 4 Beech St
- 42 Fisher St
- 462 Hartford Ave
- 56 Fisher St
- 2 Kingson Ln Unit 2
- 28 Fisher St
- 394 Village St
- 6 Freedom Trail
- 22 Milford St
- 4 Linda Ln
- 8 Liberty Rd
- 23 Cedar Farms Rd
- 8 Apache Rd
- 56 Puddingstone Ln
- 19 Sahlin Cir
- 10 Franklin St
- 20 Hawthorne Village Unit A
Your Personal Tour Guide
Ask me questions while you tour the home.