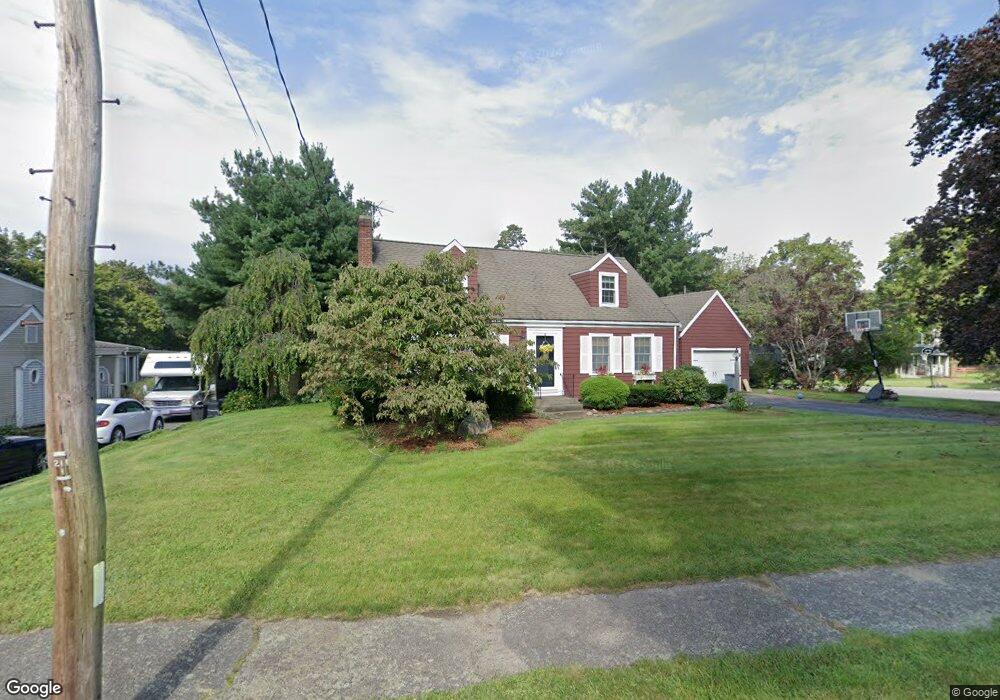
5 Holly Rd Walpole, MA 02081
Estimated Value: $669,000 - $805,000
3
Beds
2
Baths
1,550
Sq Ft
$473/Sq Ft
Est. Value
About This Home
This home is located at 5 Holly Rd, Walpole, MA 02081 and is currently estimated at $733,693, approximately $473 per square foot. 5 Holly Rd is a home located in Norfolk County with nearby schools including Old Post Road School, Walpole Middle School, and Walpole High School.
Ownership History
Date
Name
Owned For
Owner Type
Purchase Details
Closed on
Jul 15, 2013
Sold by
Ellis Steven C and Ellis Maureen C
Bought by
Federer Jenna K and Federer Christopher R
Current Estimated Value
Home Financials for this Owner
Home Financials are based on the most recent Mortgage that was taken out on this home.
Original Mortgage
$333,000
Outstanding Balance
$241,216
Interest Rate
3.83%
Mortgage Type
New Conventional
Estimated Equity
$492,477
Create a Home Valuation Report for This Property
The Home Valuation Report is an in-depth analysis detailing your home's value as well as a comparison with similar homes in the area
Home Values in the Area
Average Home Value in this Area
Purchase History
| Date | Buyer | Sale Price | Title Company |
|---|---|---|---|
| Federer Jenna K | $391,000 | -- |
Source: Public Records
Mortgage History
| Date | Status | Borrower | Loan Amount |
|---|---|---|---|
| Open | Federer Jenna K | $333,000 |
Source: Public Records
Tax History Compared to Growth
Tax History
| Year | Tax Paid | Tax Assessment Tax Assessment Total Assessment is a certain percentage of the fair market value that is determined by local assessors to be the total taxable value of land and additions on the property. | Land | Improvement |
|---|---|---|---|---|
| 2025 | $7,908 | $616,400 | $332,100 | $284,300 |
| 2024 | $7,685 | $581,300 | $319,300 | $262,000 |
| 2023 | $7,406 | $533,200 | $277,600 | $255,600 |
| 2022 | $6,915 | $478,200 | $257,100 | $221,100 |
| 2021 | $6,510 | $438,700 | $242,500 | $196,200 |
| 2020 | $6,395 | $426,600 | $228,700 | $197,900 |
| 2019 | $6,202 | $410,700 | $219,800 | $190,900 |
| 2018 | $5,858 | $383,600 | $211,700 | $171,900 |
| 2017 | $5,661 | $369,300 | $203,500 | $165,800 |
| 2016 | $5,560 | $357,300 | $197,600 | $159,700 |
| 2015 | $5,371 | $342,100 | $188,400 | $153,700 |
| 2014 | $5,179 | $328,600 | $188,400 | $140,200 |
Source: Public Records
Map
Nearby Homes
- 486 Washington St
- 8 Rainbow Pond Dr Unit 8
- 41 Gill St Unit A
- 881 Main St Unit 9
- 1 Providence Hwy
- 1 Palace Ct
- 270 Moosehill Rd
- 246 Pemberton St
- Unit 11 Powder House Ln Unit 11
- 8 Powder House Ln Unit 2
- Unit 12 Powder House Ln Unit 12
- Unit 3 Powder House Ln Unit 3
- 145 South St Unit 5
- 260 Elm St
- 635 Old Post Rd Unit 303
- 635 Old Post Rd Unit 302
- 0 Charlotte Rd
- 272 Union St Unit 272
- 19 and 23 Arlington Ln
- 587 Common St