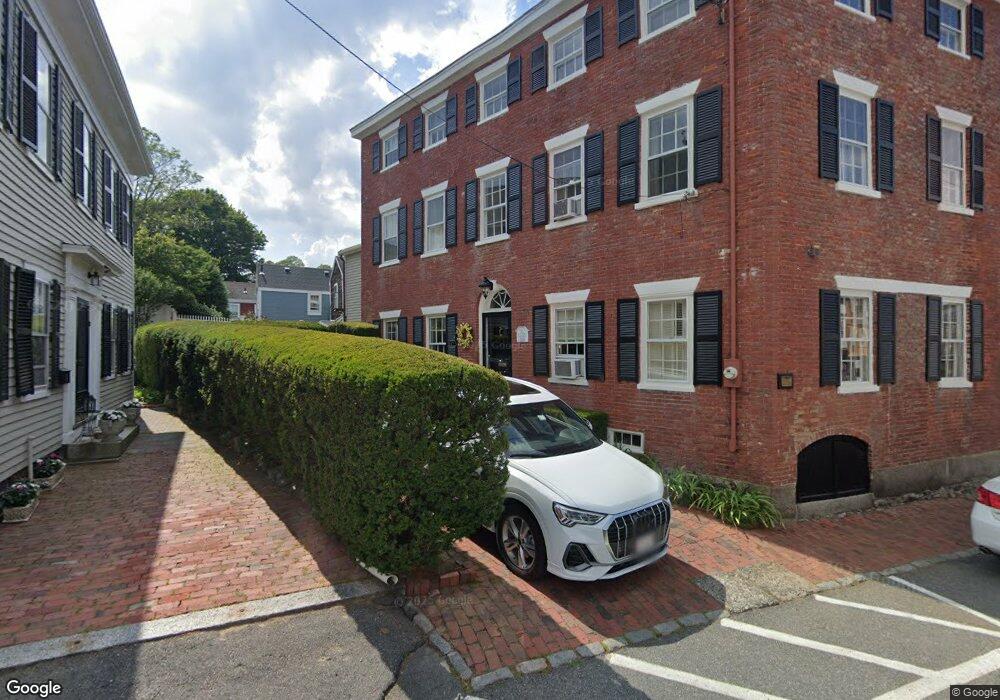
5 Hooper St Marblehead, MA 01945
Estimated Value: $1,217,000 - $1,613,000
3
Beds
3
Baths
2,463
Sq Ft
$594/Sq Ft
Est. Value
About This Home
This home is located at 5 Hooper St, Marblehead, MA 01945 and is currently estimated at $1,463,118, approximately $594 per square foot. 5 Hooper St is a home located in Essex County with nearby schools including Marblehead High School, Marblehead Community Charter Public School, and Devereux School.
Ownership History
Date
Name
Owned For
Owner Type
Purchase Details
Closed on
Jul 21, 2011
Sold by
Redfield Douglas and Redfield Susan
Bought by
Judy John T and Alling Mary E
Current Estimated Value
Home Financials for this Owner
Home Financials are based on the most recent Mortgage that was taken out on this home.
Original Mortgage
$230,000
Outstanding Balance
$155,781
Interest Rate
4.49%
Mortgage Type
Purchase Money Mortgage
Estimated Equity
$1,307,337
Purchase Details
Closed on
Nov 9, 2001
Sold by
Eustice Richard C and Mattson Roy I
Bought by
Redfield Douglas and Redfield Susan
Purchase Details
Closed on
Jan 31, 1996
Sold by
Caldwell John R and Caldwell Wendy
Bought by
Mattson Roy and Eustice Richard C
Purchase Details
Closed on
Apr 29, 1988
Sold by
5 Hooper St Rt
Bought by
Caldwell John R
Create a Home Valuation Report for This Property
The Home Valuation Report is an in-depth analysis detailing your home's value as well as a comparison with similar homes in the area
Home Values in the Area
Average Home Value in this Area
Purchase History
| Date | Buyer | Sale Price | Title Company |
|---|---|---|---|
| Judy John T | $750,000 | -- | |
| Judy John T | $750,000 | -- | |
| Redfield Douglas | $824,000 | -- | |
| Mattson Roy | $405,000 | -- | |
| Mattson Roy | $405,000 | -- | |
| Caldwell John R | $415,000 | -- |
Source: Public Records
Mortgage History
| Date | Status | Borrower | Loan Amount |
|---|---|---|---|
| Open | Caldwell John R | $230,000 | |
| Closed | Caldwell John R | $230,000 |
Source: Public Records
Tax History Compared to Growth
Tax History
| Year | Tax Paid | Tax Assessment Tax Assessment Total Assessment is a certain percentage of the fair market value that is determined by local assessors to be the total taxable value of land and additions on the property. | Land | Improvement |
|---|---|---|---|---|
| 2025 | $12,563 | $1,388,200 | $689,700 | $698,500 |
| 2024 | $11,976 | $1,336,600 | $689,700 | $646,900 |
| 2023 | $11,069 | $1,106,900 | $594,200 | $512,700 |
| 2022 | $11,337 | $1,077,700 | $530,600 | $547,100 |
| 2021 | $11,118 | $1,067,000 | $519,900 | $547,100 |
| 2020 | $9,956 | $958,200 | $509,300 | $448,900 |
| 2019 | $9,950 | $926,400 | $477,500 | $448,900 |
| 2018 | $9,624 | $873,300 | $424,400 | $448,900 |
| 2017 | $9,382 | $852,100 | $403,200 | $448,900 |
| 2016 | $8,988 | $809,700 | $360,800 | $448,900 |
| 2015 | $8,806 | $794,800 | $339,600 | $455,200 |
| 2014 | $8,620 | $777,300 | $339,600 | $437,700 |
Source: Public Records
Map
Nearby Homes
- 7 Lee St Unit 3
- 45 Pleasant St
- 66 Pleasant St Unit 1
- 66 Pleasant St Unit 2
- 7 Mechanic Ct
- 132 Elm St
- 132 Elm St Unit 132
- 20 Mechanic Square Unit 3
- 20 Mechanic Square Unit 2
- 134 Elm St
- 1 Green St Unit 2
- 102 Front St Unit 1
- 3 Frost Ln Unit 1
- 15 Lindsey St
- 29 High St
- 24 Russell St
- 290 Washington St Unit 1
- 75 Pond St
- 51 Lincoln Ave
- 27 Village St Unit 1
- 3 Hooper St Unit 1
- 3 Hooper St
- 9 Hooper St
- 160 Washington St Unit 1
- 160 Washington St Unit 2
- 160 Washington St
- 164 Washington St Unit A
- 164 Washington St Unit A
- 164 Washington St
- 164 Washington St Unit 2
- 158 Washington St
- 166 Washington St
- 11 Hooper St
- 2 Mason St
- 2 Mason St Unit 3
- 2 Mason St Unit 1
- 2 Mason St Unit 2
- 5 Tucker St
- 13 Hooper St
- 13 Hooper St Unit 1