Estimated Value: $53,000 - $208,000
--
Bed
--
Bath
--
Sq Ft
6,098
Sq Ft Lot
About This Home
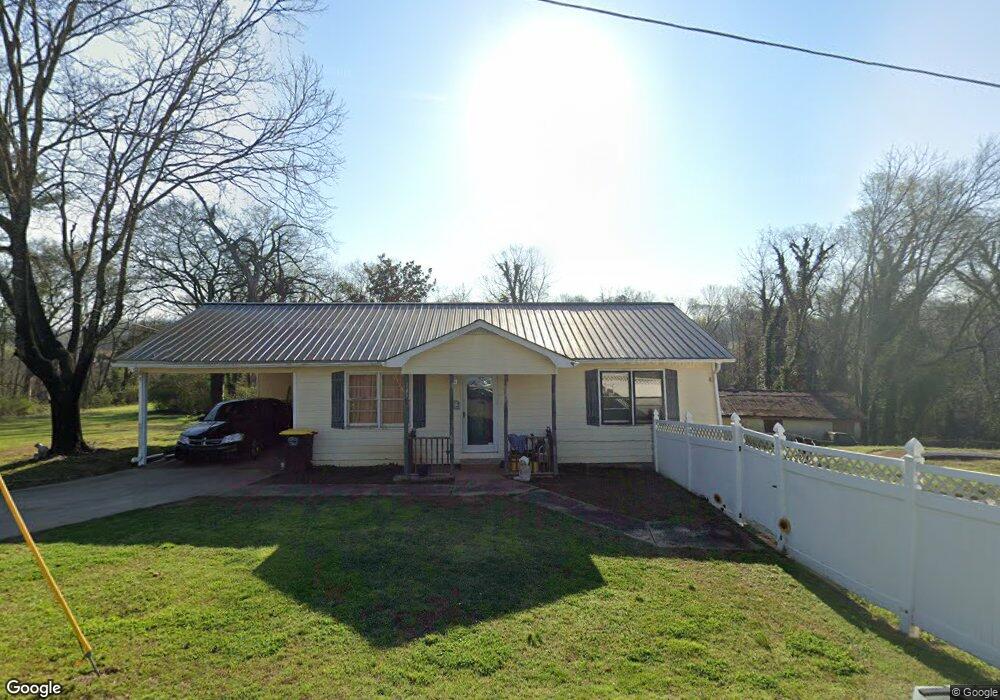
This home is located at 5 Hopewell St SW, Rome, GA 30161 and is currently estimated at $117,000. 5 Hopewell St SW is a home located in Floyd County with nearby schools including Dan McCarty Middle School, Rome High School, and Darlington School.
Ownership History
Date
Name
Owned For
Owner Type
Purchase Details
Closed on
Jul 30, 2012
Sold by
Federal National Mortgage Association
Bought by
Culp Joanne Marie
Current Estimated Value
Purchase Details
Closed on
Mar 29, 2012
Sold by
Reynolds Patsy Ann
Bought by
Jpmorgan Chase Bank National Association
Purchase Details
Closed on
Dec 6, 2011
Sold by
Jpmorgan Chase Bank Nation
Bought by
Federal National Mtg Associati
Purchase Details
Closed on
Feb 12, 2001
Sold by
Hudson Donna F
Bought by
Reynolds Patsy Ann
Purchase Details
Closed on
Mar 8, 1996
Sold by
Huckaby James Calvin Sr Est
Bought by
Hudson Donna F
Purchase Details
Closed on
Aug 28, 1977
Sold by
Taylor J Raine
Bought by
Huckaby Arlette H and Huckaby Jc
Purchase Details
Closed on
Sep 27, 1976
Sold by
Taylor Taylor J and Taylor Ga
Bought by
Taylor J Raine
Purchase Details
Closed on
May 16, 1969
Sold by
Knowles Elizabeth
Bought by
Taylor Taylor J and Taylor Ga
Purchase Details
Closed on
Jan 1, 1901
Bought by
Knowles Elizabeth
Create a Home Valuation Report for This Property
The Home Valuation Report is an in-depth analysis detailing your home's value as well as a comparison with similar homes in the area
Home Values in the Area
Average Home Value in this Area
Purchase History
| Date | Buyer | Sale Price | Title Company |
|---|---|---|---|
| Culp Joanne Marie | -- | -- | |
| Jpmorgan Chase Bank National Association | $3,700 | -- | |
| Federal National Mtg Associati | $52,700 | -- | |
| Jpmorgan Chase Bank National A | $52,700 | -- | |
| Reynolds Patsy Ann | $1,900 | -- | |
| Hudson Donna F | $49,500 | -- | |
| Huckaby James Calvin Sr Est | -- | -- | |
| Huckaby Arlette H | $950,000 | -- | |
| Taylor J Raine | $100,000 | -- | |
| Taylor Taylor J | $1,200 | -- | |
| Knowles Elizabeth | -- | -- |
Source: Public Records
Tax History Compared to Growth
Tax History
| Year | Tax Paid | Tax Assessment Tax Assessment Total Assessment is a certain percentage of the fair market value that is determined by local assessors to be the total taxable value of land and additions on the property. | Land | Improvement |
|---|---|---|---|---|
| 2024 | $156 | $3,970 | $3,970 | $0 |
| 2023 | $141 | $3,610 | $3,610 | $0 |
| 2022 | $105 | $2,888 | $2,888 | $0 |
| 2021 | $107 | $2,888 | $2,888 | $0 |
| 2020 | $84 | $2,256 | $2,256 | $0 |
| 2019 | $84 | $2,256 | $2,256 | $0 |
| 2018 | $84 | $2,256 | $2,256 | $0 |
| 2017 | $84 | $2,256 | $2,256 | $0 |
| 2016 | $83 | $2,240 | $2,240 | $0 |
| 2015 | $79 | $2,240 | $2,240 | $0 |
| 2014 | $79 | $2,240 | $2,240 | $0 |
Source: Public Records
Map
Nearby Homes
- 1901 Hull Ave SW
- 106 E 14th St SW
- 316 S McLin St SW
- 000 E Oglethorpe Hwy
- 39 E 16th St SW
- 304 E 19th St SW
- 2014 Maple Ave SW
- 1502 Spring Creek St SW
- 1705 Olmstead St SW
- 4 E 15th St SW
- 14 Clover St SW
- 414 E 17th St SW
- 2108 Maple Ave SW
- 164 E 11th St SE
- 7 Willingham St SW
- 168 E 11th St SE
- 0 Martha Berry Hwy Unit 7525627
- 0 Martha Berry Hwy Unit 7614774
- 0 Martha Berry Hwy Unit 10563404
- 13 N Blanche Ave SW
- 5 Hopewell St SW
- 5 Hopewell St SW
- 5 Hopewell St SW
- 6 Hopewell St SW
- 2 Hopewell St SW
- 26 Crescent Ave SW
- 24 Crescent Ave SW
- 24 Crescent Ave SW
- 100 Crescent Ave SW
- 104 Crescent Ave SW
- 104 Crescent Ave SW
- 34 Higgins St SW
- 0 Higgins St
- 4 Lumber St SW
- 102 Crescent Ave SW
- 20 Crescent Ave SW
- 16 Crescent Ave SW
- 106 Crescent Ave SW
- 10 Lumber St SW
- 103 Crescent Ave SW