Estimated Value: $1,263,255 - $1,417,000
6
Beds
4
Baths
3,678
Sq Ft
$359/Sq Ft
Est. Value
About This Home
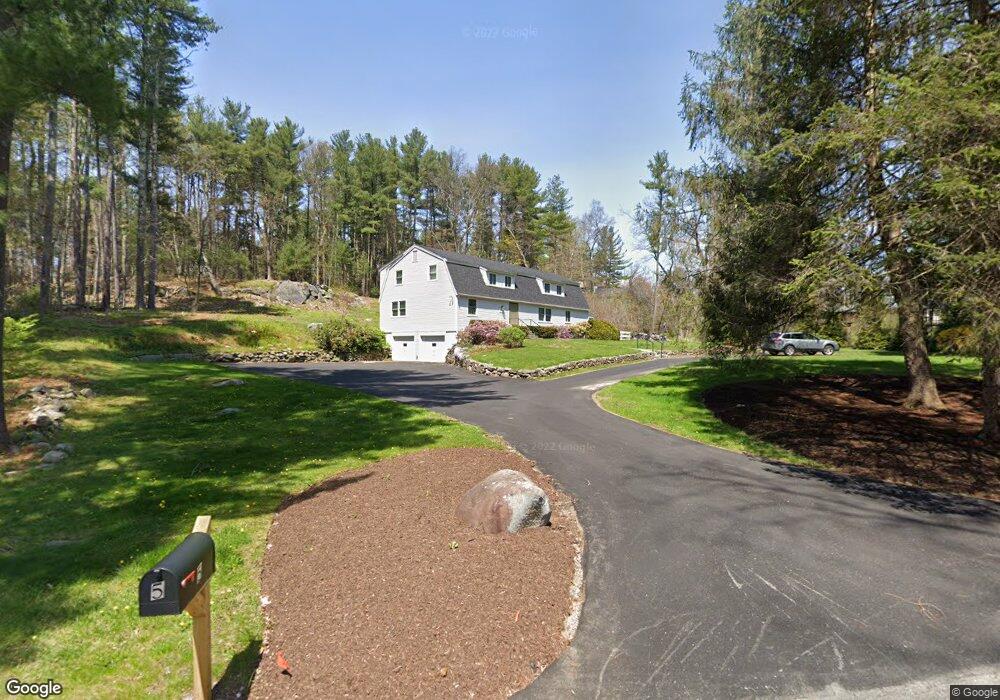
This home is located at 5 Huckleberry Ln, Acton, MA 01720 and is currently estimated at $1,320,064, approximately $358 per square foot. 5 Huckleberry Ln is a home located in Middlesex County with nearby schools including Acton-Boxborough Regional High School and Oak Meadow Montessori School.
Ownership History
Date
Name
Owned For
Owner Type
Purchase Details
Closed on
Dec 11, 1989
Sold by
Petersen Glenn R
Bought by
Bergeron Joseph C
Current Estimated Value
Home Financials for this Owner
Home Financials are based on the most recent Mortgage that was taken out on this home.
Original Mortgage
$332,000
Interest Rate
9.72%
Mortgage Type
Purchase Money Mortgage
Create a Home Valuation Report for This Property
The Home Valuation Report is an in-depth analysis detailing your home's value as well as a comparison with similar homes in the area
Home Values in the Area
Average Home Value in this Area
Purchase History
| Date | Buyer | Sale Price | Title Company |
|---|---|---|---|
| Bergeron Joseph C | $415,000 | -- |
Source: Public Records
Mortgage History
| Date | Status | Borrower | Loan Amount |
|---|---|---|---|
| Closed | Bergeron Joseph C | $332,000 | |
| Previous Owner | Bergeron Joseph C | $175,000 |
Source: Public Records
Tax History Compared to Growth
Tax History
| Year | Tax Paid | Tax Assessment Tax Assessment Total Assessment is a certain percentage of the fair market value that is determined by local assessors to be the total taxable value of land and additions on the property. | Land | Improvement |
|---|---|---|---|---|
| 2025 | $18,546 | $1,081,400 | $409,800 | $671,600 |
| 2024 | $17,315 | $1,038,700 | $409,800 | $628,900 |
| 2023 | $16,887 | $961,700 | $372,200 | $589,500 |
| 2022 | $15,980 | $821,600 | $324,100 | $497,500 |
| 2021 | $15,593 | $770,800 | $299,600 | $471,200 |
| 2020 | $14,703 | $764,200 | $299,600 | $464,600 |
| 2019 | $14,551 | $751,200 | $299,600 | $451,600 |
| 2018 | $14,283 | $737,000 | $299,600 | $437,400 |
| 2017 | $13,912 | $729,900 | $299,600 | $430,300 |
| 2016 | $13,626 | $708,600 | $299,600 | $409,000 |
| 2015 | $13,364 | $701,500 | $299,600 | $401,900 |
| 2014 | $13,055 | $671,200 | $299,600 | $371,600 |
Source: Public Records
Map
Nearby Homes