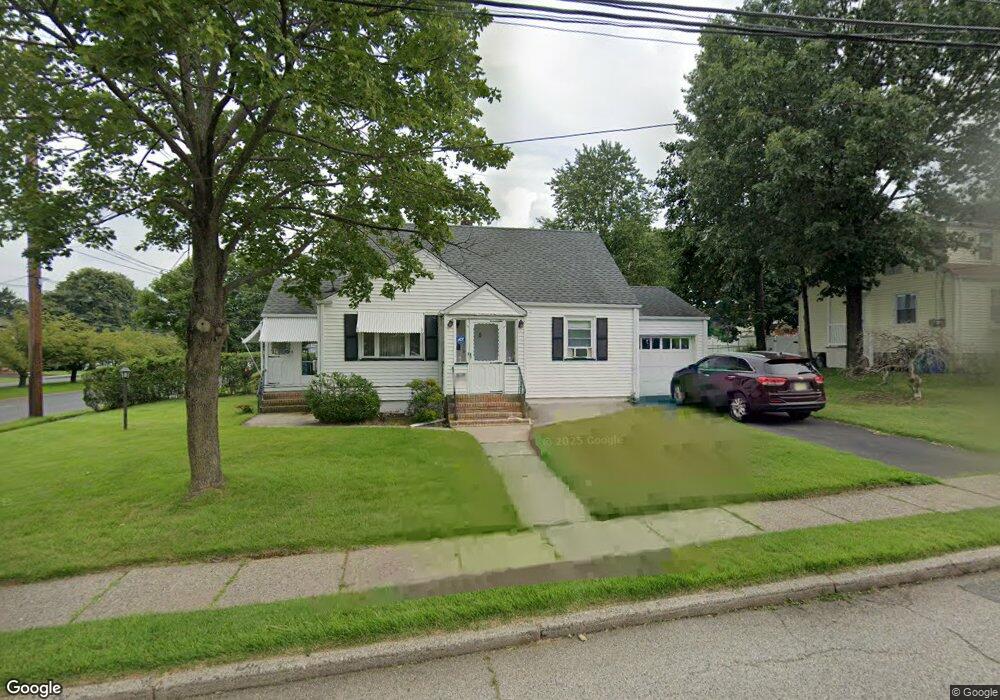
5 Hugo St Clifton, NJ 07012
Allwood NeighborhoodEstimated Value: $441,500 - $574,000
--
Bed
--
Bath
1,228
Sq Ft
$424/Sq Ft
Est. Value
About This Home
This home is located at 5 Hugo St, Clifton, NJ 07012 and is currently estimated at $520,875, approximately $424 per square foot. 5 Hugo St is a home located in Passaic County with nearby schools including Clifton High School, St Andrew Elementary School, and St Clare Elementary School.
Ownership History
Date
Name
Owned For
Owner Type
Purchase Details
Closed on
May 23, 2003
Sold by
Nava Felix
Bought by
Nava Rommy
Current Estimated Value
Purchase Details
Closed on
Aug 10, 1998
Sold by
Nava Felix E and Nava Rommy
Bought by
Nava Rommy and Nava Felix E
Home Financials for this Owner
Home Financials are based on the most recent Mortgage that was taken out on this home.
Original Mortgage
$131,186
Interest Rate
6.68%
Mortgage Type
FHA
Create a Home Valuation Report for This Property
The Home Valuation Report is an in-depth analysis detailing your home's value as well as a comparison with similar homes in the area
Home Values in the Area
Average Home Value in this Area
Purchase History
| Date | Buyer | Sale Price | Title Company |
|---|---|---|---|
| Nava Rommy | -- | -- | |
| Nava Rommy | -- | -- |
Source: Public Records
Mortgage History
| Date | Status | Borrower | Loan Amount |
|---|---|---|---|
| Previous Owner | Nava Rommy | $131,186 |
Source: Public Records
Tax History Compared to Growth
Tax History
| Year | Tax Paid | Tax Assessment Tax Assessment Total Assessment is a certain percentage of the fair market value that is determined by local assessors to be the total taxable value of land and additions on the property. | Land | Improvement |
|---|---|---|---|---|
| 2025 | $8,209 | $138,300 | $84,300 | $54,000 |
| 2024 | $8,013 | $138,300 | $84,300 | $54,000 |
| 2022 | $7,897 | $138,300 | $84,300 | $54,000 |
| 2021 | $7,572 | $138,300 | $84,300 | $54,000 |
| 2020 | $7,597 | $138,300 | $84,300 | $54,000 |
| 2019 | $7,543 | $138,300 | $84,300 | $54,000 |
| 2018 | $7,500 | $138,300 | $84,300 | $54,000 |
| 2017 | $7,418 | $138,300 | $84,300 | $54,000 |
| 2016 | $7,275 | $138,300 | $84,300 | $54,000 |
| 2015 | $7,204 | $138,300 | $84,300 | $54,000 |
| 2014 | $7,056 | $138,300 | $84,300 | $54,000 |
Source: Public Records
Map
Nearby Homes