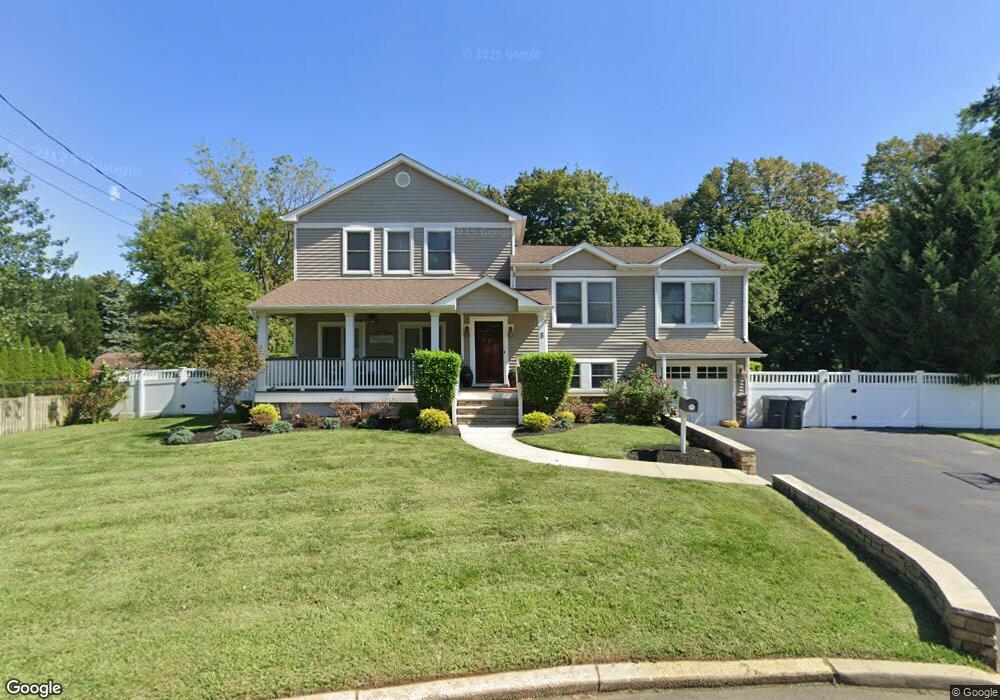
5 Irma Place Unit WINTER Oceanport, NJ 07757
Estimated Value: $1,030,000 - $1,188,000
3
Beds
3
Baths
3,068
Sq Ft
$355/Sq Ft
Est. Value
About This Home
This home is located at 5 Irma Place Unit WINTER, Oceanport, NJ 07757 and is currently estimated at $1,089,273, approximately $355 per square foot. 5 Irma Place Unit WINTER is a home located in Monmouth County with nearby schools including Wolf Hill Elementary School, Maple Place Elementary and Middle School, and Shore Regional High School.
Ownership History
Date
Name
Owned For
Owner Type
Purchase Details
Closed on
Jan 26, 2006
Sold by
Detweiler Lillian S
Bought by
Karlson Kristian and Karlson Jennifer
Current Estimated Value
Home Financials for this Owner
Home Financials are based on the most recent Mortgage that was taken out on this home.
Original Mortgage
$277,000
Outstanding Balance
$156,954
Interest Rate
6.31%
Mortgage Type
New Conventional
Estimated Equity
$932,319
Create a Home Valuation Report for This Property
The Home Valuation Report is an in-depth analysis detailing your home's value as well as a comparison with similar homes in the area
Home Values in the Area
Average Home Value in this Area
Purchase History
| Date | Buyer | Sale Price | Title Company |
|---|---|---|---|
| Karlson Kristian | $377,000 | -- |
Source: Public Records
Mortgage History
| Date | Status | Borrower | Loan Amount |
|---|---|---|---|
| Open | Karlson Kristian | $277,000 |
Source: Public Records
Tax History Compared to Growth
Tax History
| Year | Tax Paid | Tax Assessment Tax Assessment Total Assessment is a certain percentage of the fair market value that is determined by local assessors to be the total taxable value of land and additions on the property. | Land | Improvement |
|---|---|---|---|---|
| 2025 | $11,705 | $805,900 | $368,900 | $437,000 |
| 2024 | $11,956 | $741,300 | $323,300 | $418,000 |
| 2023 | $11,956 | $718,500 | $321,400 | $397,100 |
| 2022 | $11,914 | $652,000 | $302,400 | $349,600 |
| 2021 | $11,914 | $625,400 | $292,900 | $332,500 |
| 2020 | $11,067 | $605,400 | $278,600 | $326,800 |
| 2019 | $10,698 | $594,000 | $278,600 | $315,400 |
| 2018 | $10,559 | $590,200 | $278,600 | $311,600 |
| 2017 | $9,575 | $443,900 | $168,800 | $275,100 |
| 2016 | $9,584 | $447,200 | $177,300 | $269,900 |
| 2015 | $9,130 | $440,200 | $177,300 | $262,900 |
| 2014 | $8,785 | $429,600 | $196,300 | $233,300 |
Source: Public Records
Map
Nearby Homes