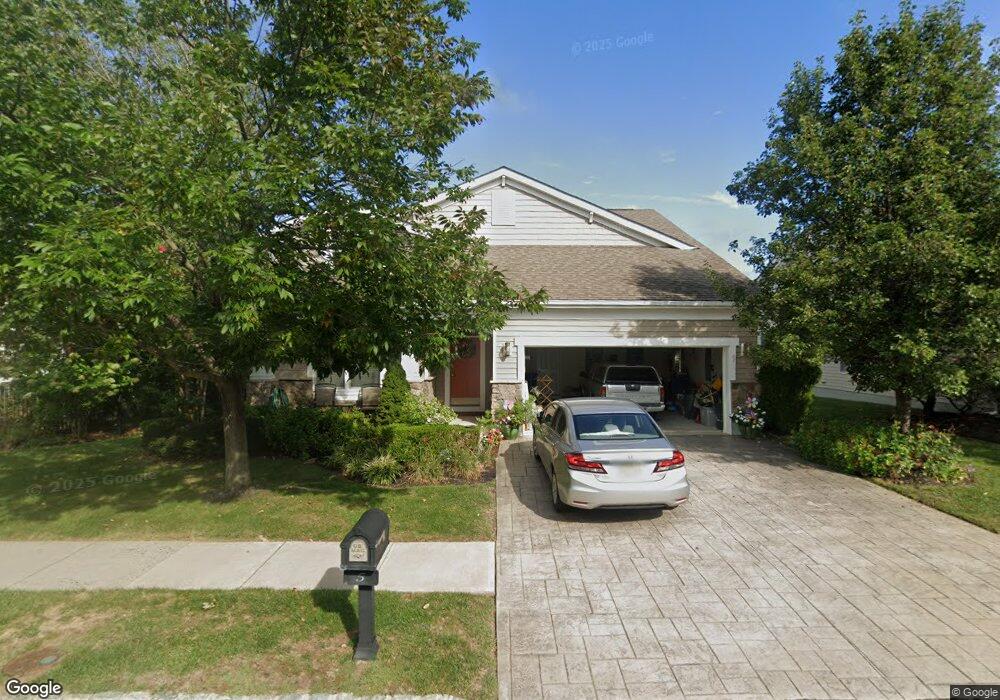
5 Iselin Ln Oceanport, NJ 07757
Estimated Value: $882,742 - $1,010,000
2
Beds
1
Bath
1,874
Sq Ft
$513/Sq Ft
Est. Value
About This Home
This home is located at 5 Iselin Ln, Oceanport, NJ 07757 and is currently estimated at $961,186, approximately $512 per square foot. 5 Iselin Ln is a home with nearby schools including Wolf Hill Elementary School, Maple Place Elementary and Middle School, and Shore Regional High School.
Ownership History
Date
Name
Owned For
Owner Type
Purchase Details
Closed on
Nov 4, 2024
Sold by
Naughton Thomas V and Naughton Mary P
Bought by
Thomas V Naughton And Mary P Naughton Irrevoc and Naughton
Current Estimated Value
Purchase Details
Closed on
May 26, 2010
Sold by
K Hovnanian At Oceanport Llc
Bought by
Naughton Thomas and Naughton Mary P
Home Financials for this Owner
Home Financials are based on the most recent Mortgage that was taken out on this home.
Original Mortgage
$250,000
Interest Rate
3.87%
Mortgage Type
New Conventional
Create a Home Valuation Report for This Property
The Home Valuation Report is an in-depth analysis detailing your home's value as well as a comparison with similar homes in the area
Home Values in the Area
Average Home Value in this Area
Purchase History
| Date | Buyer | Sale Price | Title Company |
|---|---|---|---|
| Thomas V Naughton And Mary P Naughton Irrevoc | -- | None Listed On Document | |
| Thomas V Naughton And Mary P Naughton Irrevoc | -- | None Listed On Document | |
| Thomas V Naughton And Mary P Naughton Irrevoc | -- | None Listed On Document | |
| Naughton Thomas | $472,107 | Chicago Title Insurance Co |
Source: Public Records
Mortgage History
| Date | Status | Borrower | Loan Amount |
|---|---|---|---|
| Previous Owner | Naughton Thomas | $250,000 |
Source: Public Records
Tax History
| Year | Tax Paid | Tax Assessment Tax Assessment Total Assessment is a certain percentage of the fair market value that is determined by local assessors to be the total taxable value of land and additions on the property. | Land | Improvement |
|---|---|---|---|---|
| 2025 | $12,307 | $813,900 | $420,200 | $393,700 |
| 2024 | $12,307 | $779,400 | $400,200 | $379,200 |
| 2023 | $12,307 | $739,600 | $375,200 | $364,400 |
| 2022 | $11,434 | $644,600 | $320,200 | $324,400 |
| 2021 | $11,434 | $600,200 | $288,200 | $312,000 |
| 2020 | $10,516 | $575,300 | $265,200 | $310,100 |
| 2019 | $10,226 | $567,800 | $265,200 | $302,600 |
| 2018 | $10,151 | $567,400 | $265,200 | $302,200 |
| 2017 | $9,922 | $460,000 | $225,200 | $234,800 |
| 2016 | $9,828 | $458,600 | $225,200 | $233,400 |
| 2015 | $9,449 | $455,600 | $225,200 | $230,400 |
| 2014 | $8,949 | $437,600 | $225,200 | $212,400 |
Source: Public Records
Map
Nearby Homes
- 14 Oceanport Ave
- 66 Pemberton Ave
- 37 Steeplechase Ct
- 15 Maple Ave
- 0 Elkwood Ave
- 28 Fairfield Ave
- 265 Port Au Peck Ave
- 35 Avon Ave
- 24 Burntmill Cir
- 11 Avon Ave
- 10 Asbury Ave
- 25 Monmouth Rd Unit 2
- 13 Saratoga
- 58 Monmouth Rd
- 8 Hialeah
- 12 Balmer Ct
- 10 Sunset Rd
- 1 Foggia Way
- 3 Sandbar Aly
- 448 Branchport Ave
Your Personal Tour Guide
Ask me questions while you tour the home.