5 Island View Way Unit 28 Sea Bright, NJ 07760
Sea Bright NeighborhoodEstimated Value: $856,000 - $939,000
2
Beds
4
Baths
1,189
Sq Ft
$762/Sq Ft
Est. Value
About This Home
This home is located at 5 Island View Way Unit 28, Sea Bright, NJ 07760 and is currently estimated at $905,792, approximately $761 per square foot. 5 Island View Way Unit 28 is a home located in Monmouth County with nearby schools including Wolf Hill Elementary School, Maple Place Elementary and Middle School, and Shore Regional High School.
Ownership History
Date
Name
Owned For
Owner Type
Purchase Details
Closed on
Oct 28, 2022
Sold by
Meg Management Llc
Bought by
Suskauer David and Suskauer Mara
Current Estimated Value
Purchase Details
Closed on
Mar 23, 2022
Sold by
Island View Townhouse Association Inc
Bought by
Island View Townhouse Association Inc
Purchase Details
Closed on
Aug 25, 2021
Sold by
Morris Laurence S and Morris Kathleen T
Bought by
Schiada Luke and Ranieri Stefanie
Home Financials for this Owner
Home Financials are based on the most recent Mortgage that was taken out on this home.
Original Mortgage
$479,000
Interest Rate
2.8%
Mortgage Type
New Conventional
Create a Home Valuation Report for This Property
The Home Valuation Report is an in-depth analysis detailing your home's value as well as a comparison with similar homes in the area
Home Values in the Area
Average Home Value in this Area
Purchase History
| Date | Buyer | Sale Price | Title Company |
|---|---|---|---|
| Suskauer David | -- | Max Title Agency | |
| Suskauer David | -- | Max Title Agency | |
| Island View Townhouse Association Inc | -- | Catelli Law Firm Llc | |
| Schiada Luke | $679,000 | Foundation Title Llc |
Source: Public Records
Mortgage History
| Date | Status | Borrower | Loan Amount |
|---|---|---|---|
| Previous Owner | Schiada Luke | $479,000 |
Source: Public Records
Tax History Compared to Growth
Tax History
| Year | Tax Paid | Tax Assessment Tax Assessment Total Assessment is a certain percentage of the fair market value that is determined by local assessors to be the total taxable value of land and additions on the property. | Land | Improvement |
|---|---|---|---|---|
| 2025 | $7,636 | $844,500 | $594,500 | $250,000 |
| 2024 | $7,013 | $798,700 | $565,000 | $233,700 |
| 2023 | $7,013 | $684,900 | $484,000 | $200,900 |
| 2022 | $6,178 | $571,200 | $404,000 | $167,200 |
| 2021 | $5,989 | $496,200 | $354,000 | $142,200 |
| 2020 | $5,989 | $466,400 | $330,000 | $136,400 |
| 2019 | $6,001 | $442,200 | $309,000 | $133,200 |
| 2018 | $6,018 | $419,100 | $274,000 | $145,100 |
| 2017 | $5,846 | $400,700 | $260,000 | $140,700 |
| 2016 | $5,463 | $418,600 | $285,000 | $133,600 |
| 2015 | $5,952 | $296,700 | $150,000 | $146,700 |
| 2014 | $6,930 | $347,000 | $220,000 | $127,000 |
Source: Public Records
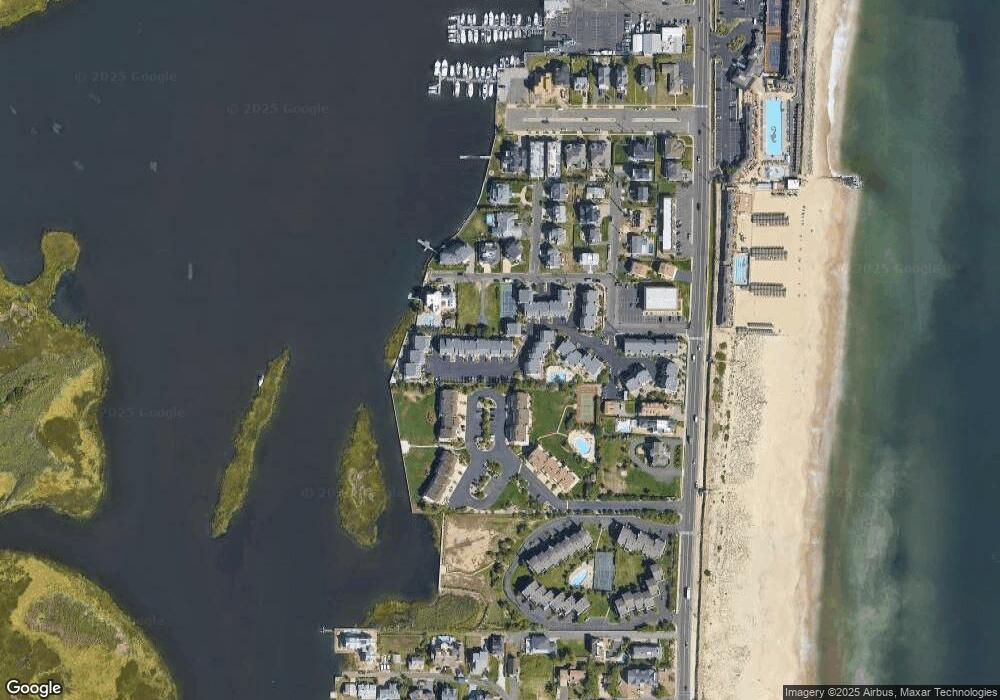
Map
Nearby Homes
- 5 Island View Way Unit 3
- 1492 Ocean Ave Unit A3
- 10 Imbrie Place
- 1566 Ocean Ave Unit 38
- 1500 Ocean Ave
- 1382 Ocean Ave Unit 17A
- 1340 Ocean Ave Unit 27
- 1332 Ocean Ave Unit 5
- 100 Seaview Ave Unit 3B
- 2 Tradewinds Ln
- 75 Wharfside Dr
- 1184 Ocean Ave Unit A3
- 149 Wharfside Dr Unit 705
- 26 Center St
- 173 Wharfside Dr Unit 805
- 24 Surf St
- 24 Warren St
- 10 South St
- 11 South St
- 1080 Ocean Ave Unit 402
- 5 Island View Way Unit 57
- 5 Island View Way Unit 29
- 5 Island View Way Unit 30
- 5 Island View Way Unit 21
- 5 Island View Way Unit 32
- 5 Island View Way Unit 18
- 5 Island View Way Unit 26
- 5 Island View Way Unit 17
- 5 Island View Way Unit 24
- 5 Island View Way Unit 20
- 5 Island View Way Unit 23
- 5 Island View Way Unit 25
- 5 Island View Way Unit 22
- 5 Island View Way Unit 14
- 5 Island View Way Unit 16
- 5 Island View Way Unit 49
- 5 Island View Way Unit 35
- 5 Island View Way Unit 34
- 5 Island View Way Unit 33
- 5 Island View Way Unit 31