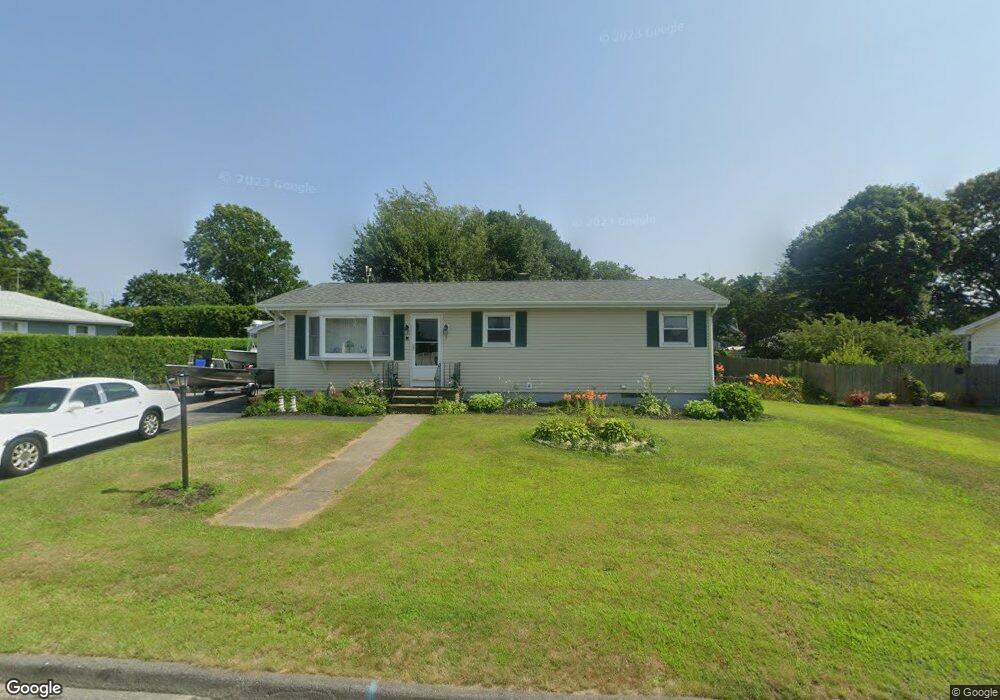
5 Jameson St Fairhaven, MA 02719
Pope Beach NeighborhoodEstimated Value: $407,000 - $507,000
Studio
1
Bath
1,056
Sq Ft
$432/Sq Ft
Est. Value
About This Home
This home is located at 5 Jameson St, Fairhaven, MA 02719 and is currently estimated at $456,675, approximately $432 per square foot. 5 Jameson St is a home located in Bristol County with nearby schools including Fairhaven High School, City On A Hill Charter Public School New Bedford, and St. Joseph School.
Ownership History
Date
Name
Owned For
Owner Type
Purchase Details
Closed on
Jan 9, 2019
Sold by
Botelho Eugene S
Bought by
Botelho Michael J
Current Estimated Value
Purchase Details
Closed on
May 8, 2014
Sold by
Botelho Eugene V and Botelho Irene J
Bought by
Botelho David M and Botelho Michael J
Purchase Details
Closed on
Mar 10, 2006
Sold by
Botelho Eugene V and Botelho Irene J
Bought by
Botelho David M and Botelho Eugene
Create a Home Valuation Report for This Property
The Home Valuation Report is an in-depth analysis detailing your home's value as well as a comparison with similar homes in the area
Home Values in the Area
Average Home Value in this Area
Purchase History
| Date | Buyer | Sale Price | Title Company |
|---|---|---|---|
| Botelho Michael J | -- | -- | |
| Botelho David M | -- | -- | |
| Botelho David M | -- | -- |
Source: Public Records
Tax History
| Year | Tax Paid | Tax Assessment Tax Assessment Total Assessment is a certain percentage of the fair market value that is determined by local assessors to be the total taxable value of land and additions on the property. | Land | Improvement |
|---|---|---|---|---|
| 2025 | $35 | $371,400 | $175,500 | $195,900 |
| 2024 | $3,206 | $347,300 | $175,500 | $171,800 |
| 2023 | $3,061 | $307,600 | $153,700 | $153,900 |
| 2022 | $2,895 | $283,300 | $142,800 | $140,500 |
| 2021 | $2,759 | $244,400 | $129,200 | $115,200 |
| 2020 | $2,703 | $244,400 | $129,200 | $115,200 |
| 2019 | $2,565 | $219,800 | $107,200 | $112,600 |
| 2018 | $2,453 | $208,800 | $102,000 | $106,800 |
| 2017 | $2,443 | $202,900 | $102,000 | $100,900 |
| 2016 | $2,409 | $197,800 | $102,000 | $95,800 |
| 2015 | $2,380 | $195,900 | $102,000 | $93,900 |
Source: Public Records
Map
Nearby Homes
- 58 Bayview Ave
- 27 Bayview Ave
- 15 Bayview Ave
- 3.5 Golf St
- 00 Copeland St
- 190 Sconticut Neck Rd
- 8 Manor Dr
- 00 Huttleston Ave
- 33 Narragansett Blvd
- 181 Washington St
- 2 Washburn Ave
- 11 Lawton St
- 145 Pleasant St
- 77 Adams St
- 32 Cedar St
- 5 Reservation Rd
- 58 Washington St
- 39 Christian St
- 32 Green St
- 67 Bridge St
Your Personal Tour Guide
Ask me questions while you tour the home.