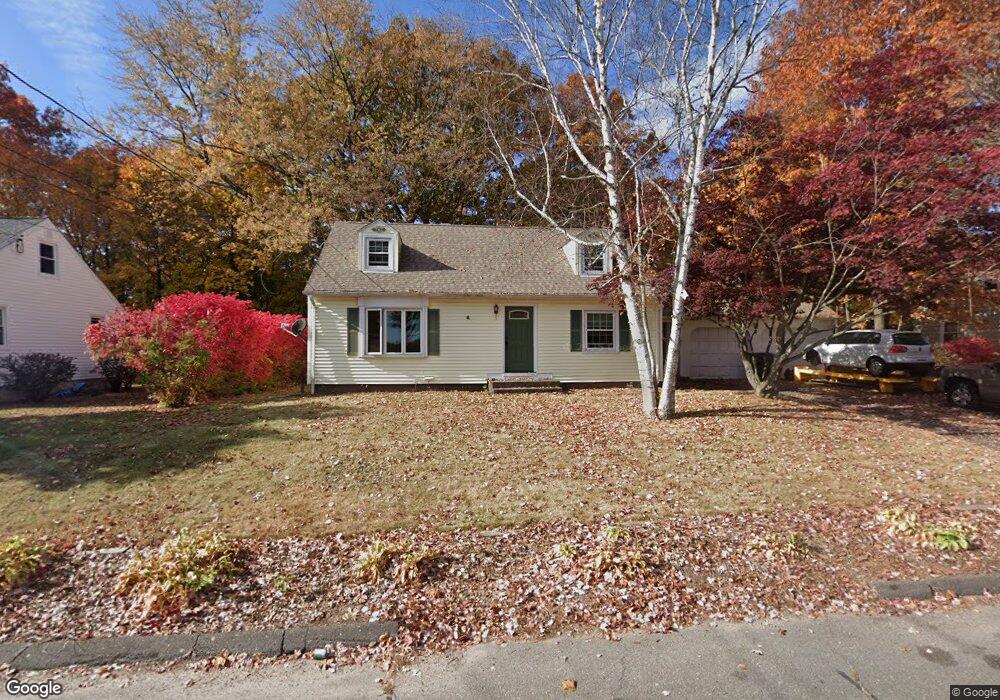
5 Joseph St Terryville, CT 06786
Estimated Value: $311,000 - $355,000
3
Beds
2
Baths
1,544
Sq Ft
$218/Sq Ft
Est. Value
About This Home
This home is located at 5 Joseph St, Terryville, CT 06786 and is currently estimated at $336,293, approximately $217 per square foot. 5 Joseph St is a home located in Litchfield County with nearby schools including Harry S. Fisher Elementary School, Eli Terry Jr. Middle School, and Terryville High School.
Ownership History
Date
Name
Owned For
Owner Type
Purchase Details
Closed on
Jun 17, 2010
Sold by
Gwizd Todd and Gwizd Jennifer
Bought by
Desaulniers Tara M and Gagnon Terry
Current Estimated Value
Home Financials for this Owner
Home Financials are based on the most recent Mortgage that was taken out on this home.
Original Mortgage
$197,240
Outstanding Balance
$135,580
Interest Rate
5.5%
Mortgage Type
FHA
Estimated Equity
$200,713
Purchase Details
Closed on
May 17, 1999
Sold by
Stafstrom Ernest E and Stafstrom Gloria H
Bought by
Gwizd Todd E and Gwizd Jennifer
Create a Home Valuation Report for This Property
The Home Valuation Report is an in-depth analysis detailing your home's value as well as a comparison with similar homes in the area
Home Values in the Area
Average Home Value in this Area
Purchase History
| Date | Buyer | Sale Price | Title Company |
|---|---|---|---|
| Desaulniers Tara M | $199,900 | -- | |
| Desaulniers Tara M | $199,900 | -- | |
| Gwizd Todd E | $125,000 | -- | |
| Gwizd Todd E | $125,000 | -- |
Source: Public Records
Mortgage History
| Date | Status | Borrower | Loan Amount |
|---|---|---|---|
| Open | Gwizd Todd E | $15,212 | |
| Open | Gwizd Todd E | $197,240 | |
| Closed | Gwizd Todd E | $197,240 |
Source: Public Records
Tax History
| Year | Tax Paid | Tax Assessment Tax Assessment Total Assessment is a certain percentage of the fair market value that is determined by local assessors to be the total taxable value of land and additions on the property. | Land | Improvement |
|---|---|---|---|---|
| 2025 | $5,501 | $139,020 | $42,350 | $96,670 |
| 2024 | $5,372 | $139,020 | $42,350 | $96,670 |
| 2023 | $5,241 | $139,020 | $42,350 | $96,670 |
| 2022 | $5,049 | $139,020 | $42,350 | $96,670 |
| 2021 | $4,505 | $110,873 | $42,070 | $68,803 |
| 2020 | $4,505 | $110,873 | $42,070 | $68,803 |
| 2019 | $4,505 | $110,873 | $42,070 | $68,803 |
| 2016 | $4,532 | $125,825 | $42,070 | $83,755 |
| 2015 | $4,458 | $125,825 | $42,070 | $83,755 |
| 2014 | $4,385 | $125,825 | $42,070 | $83,755 |
Source: Public Records
Map
Nearby Homes
- 11 William St
- 78 Kearney St
- 144 S Riverside Ave
- 146 S Riverside Ave
- Lots 16, 18 and 22 E Hill St
- 23 E Hill St
- 64 Bushnell St
- 149 S Riverside Ave
- 21 Coral Dr
- 4 Michael Dr
- 69 E Washington Rd
- 32 Union St
- 1 Michael Dr
- 55 E Washington Rd
- 16 Wood Ct
- 218 Main St
- 2 Sandra Ave
- 441 Clark Ave Unit 5
- 574 Washington Rd
- 565 Clark Ave Unit 13
Your Personal Tour Guide
Ask me questions while you tour the home.