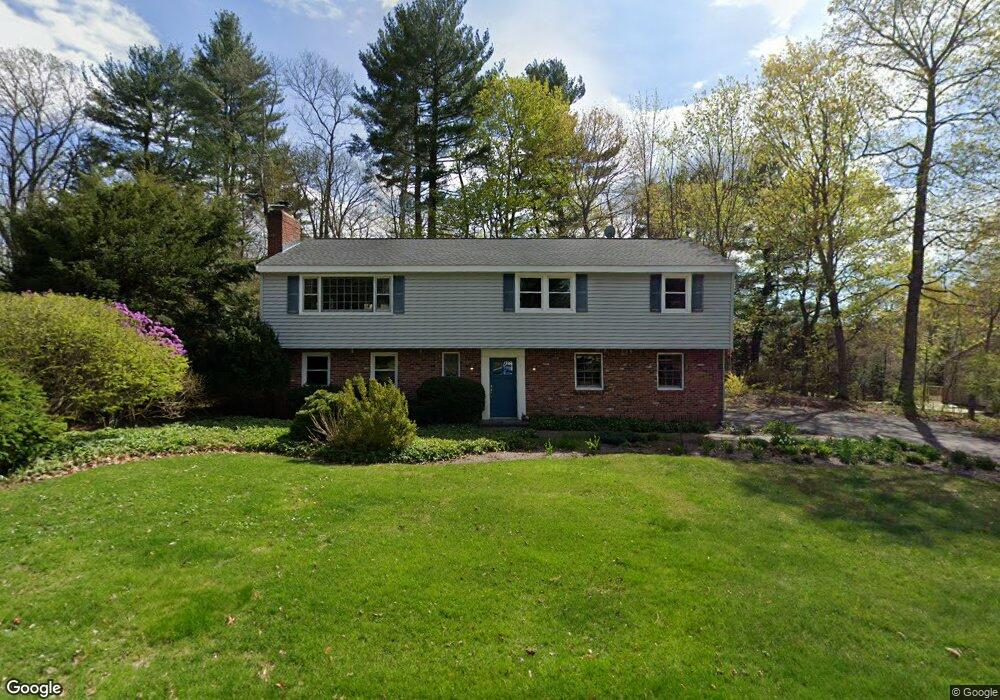
5 Keith Rd Wayland, MA 01778
Estimated Value: $888,000 - $1,059,000
3
Beds
2
Baths
1,300
Sq Ft
$738/Sq Ft
Est. Value
About This Home
This home is located at 5 Keith Rd, Wayland, MA 01778 and is currently estimated at $959,143, approximately $737 per square foot. 5 Keith Rd is a home located in Middlesex County with nearby schools including Wayland High School and Veritas Christian Academy.
Ownership History
Date
Name
Owned For
Owner Type
Purchase Details
Closed on
Jan 12, 2016
Sold by
Carroll Maryellen and Carroll Mary E
Bought by
Maryellen Carroll Ret
Current Estimated Value
Purchase Details
Closed on
Aug 16, 2000
Sold by
Swanson Arthur A and Swanson Karla F
Bought by
Carroll Maryellen
Create a Home Valuation Report for This Property
The Home Valuation Report is an in-depth analysis detailing your home's value as well as a comparison with similar homes in the area
Home Values in the Area
Average Home Value in this Area
Purchase History
| Date | Buyer | Sale Price | Title Company |
|---|---|---|---|
| Maryellen Carroll Ret | -- | -- | |
| Maryellen Carroll Ret | -- | -- | |
| Carroll Maryellen | $367,000 | -- |
Source: Public Records
Mortgage History
| Date | Status | Borrower | Loan Amount |
|---|---|---|---|
| Previous Owner | Carroll Maryellen | $40,000 | |
| Previous Owner | Carroll Maryellen | $116,000 |
Source: Public Records
Tax History
| Year | Tax Paid | Tax Assessment Tax Assessment Total Assessment is a certain percentage of the fair market value that is determined by local assessors to be the total taxable value of land and additions on the property. | Land | Improvement |
|---|---|---|---|---|
| 2025 | $12,767 | $816,800 | $515,800 | $301,000 |
| 2024 | $12,295 | $792,200 | $491,200 | $301,000 |
| 2023 | $12,251 | $735,800 | $446,500 | $289,300 |
| 2022 | $11,614 | $632,900 | $369,800 | $263,100 |
| 2021 | $11,032 | $595,700 | $336,100 | $259,600 |
| 2020 | $10,642 | $599,200 | $336,100 | $263,100 |
| 2019 | $10,133 | $554,300 | $320,100 | $234,200 |
| 2018 | $9,419 | $522,400 | $320,100 | $202,300 |
| 2017 | $9,117 | $502,600 | $310,400 | $192,200 |
| 2016 | $8,755 | $504,900 | $304,300 | $200,600 |
| 2015 | $9,099 | $494,800 | $304,300 | $190,500 |
Source: Public Records
Map
Nearby Homes
Your Personal Tour Guide
Ask me questions while you tour the home.