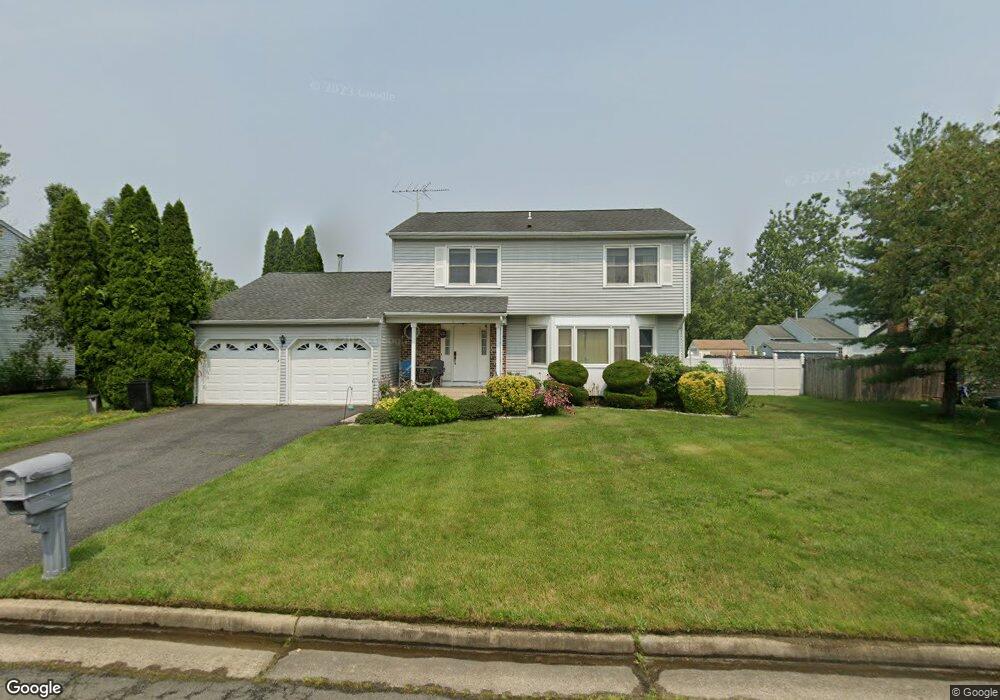
5 Kings Rd Dayton, NJ 08810
Estimated Value: $779,804 - $830,000
--
Bed
--
Bath
2,076
Sq Ft
$393/Sq Ft
Est. Value
About This Home
This home is located at 5 Kings Rd, Dayton, NJ 08810 and is currently estimated at $815,451, approximately $392 per square foot. 5 Kings Rd is a home located in Middlesex County with nearby schools including Indian Fields Elementary School, Crossroads South Middle School, and South Brunswick High School.
Ownership History
Date
Name
Owned For
Owner Type
Purchase Details
Closed on
May 7, 2002
Sold by
Shah Niraj
Bought by
Trikannad Mahesh and Trikannad Charulata
Current Estimated Value
Home Financials for this Owner
Home Financials are based on the most recent Mortgage that was taken out on this home.
Original Mortgage
$290,700
Outstanding Balance
$124,908
Interest Rate
7.18%
Estimated Equity
$690,543
Purchase Details
Closed on
Dec 22, 1999
Sold by
Dhaliwal Jagdish
Bought by
Shah Niral and Shah Keyuri
Home Financials for this Owner
Home Financials are based on the most recent Mortgage that was taken out on this home.
Original Mortgage
$191,000
Interest Rate
7.61%
Create a Home Valuation Report for This Property
The Home Valuation Report is an in-depth analysis detailing your home's value as well as a comparison with similar homes in the area
Home Values in the Area
Average Home Value in this Area
Purchase History
| Date | Buyer | Sale Price | Title Company |
|---|---|---|---|
| Trikannad Mahesh | $323,000 | -- | |
| Shah Niral | $239,000 | -- |
Source: Public Records
Mortgage History
| Date | Status | Borrower | Loan Amount |
|---|---|---|---|
| Open | Trikannad Mahesh | $290,700 | |
| Previous Owner | Shah Niral | $191,000 |
Source: Public Records
Tax History Compared to Growth
Tax History
| Year | Tax Paid | Tax Assessment Tax Assessment Total Assessment is a certain percentage of the fair market value that is determined by local assessors to be the total taxable value of land and additions on the property. | Land | Improvement |
|---|---|---|---|---|
| 2025 | $11,209 | $207,500 | $70,000 | $137,500 |
| 2024 | $10,807 | $207,500 | $70,000 | $137,500 |
| 2023 | $10,807 | $207,500 | $70,000 | $137,500 |
| 2022 | $10,485 | $207,500 | $70,000 | $137,500 |
| 2021 | $8,070 | $207,500 | $70,000 | $137,500 |
| 2020 | $10,549 | $207,500 | $70,000 | $137,500 |
| 2019 | $10,363 | $202,000 | $70,000 | $132,000 |
| 2018 | $10,023 | $202,000 | $70,000 | $132,000 |
| 2017 | $10,009 | $202,000 | $70,000 | $132,000 |
| 2016 | $9,904 | $202,000 | $70,000 | $132,000 |
| 2015 | $9,601 | $202,000 | $70,000 | $132,000 |
| 2014 | $9,446 | $202,000 | $70,000 | $132,000 |
Source: Public Records
Map
Nearby Homes