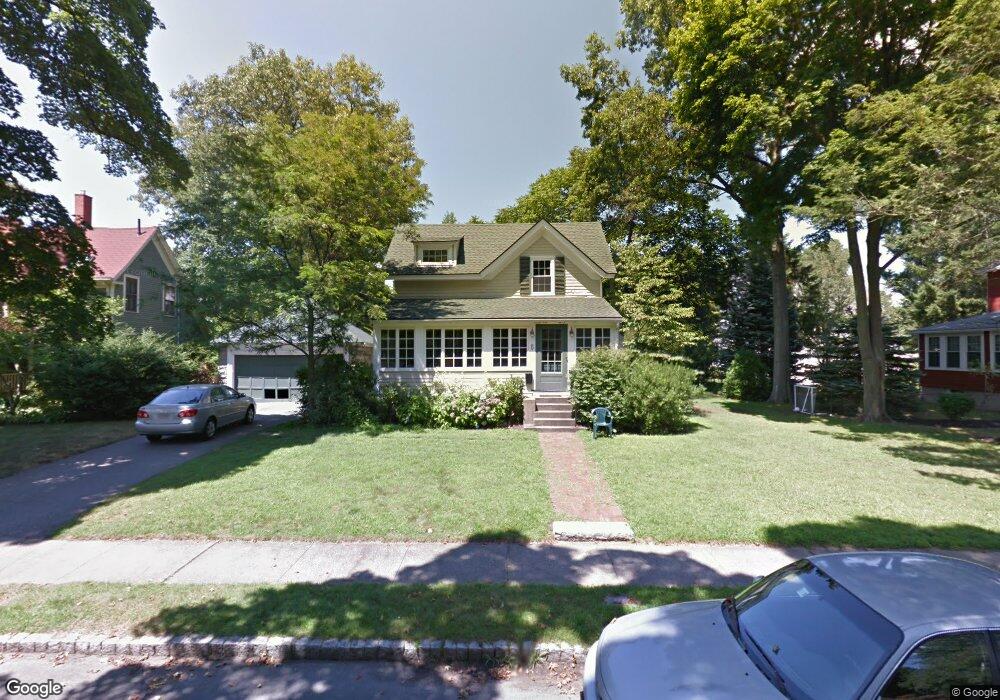
5 Lagrange St Winchester, MA 01890
The Flats NeighborhoodEstimated Value: $1,365,000 - $2,041,000
3
Beds
2
Baths
1,700
Sq Ft
$929/Sq Ft
Est. Value
About This Home
This home is located at 5 Lagrange St, Winchester, MA 01890 and is currently estimated at $1,579,903, approximately $929 per square foot. 5 Lagrange St is a home located in Middlesex County with nearby schools including Ambrose Elementary School, McCall Middle School, and Winchester High School.
Ownership History
Date
Name
Owned For
Owner Type
Purchase Details
Closed on
Jan 27, 2025
Sold by
Winner Kendra L
Bought by
Kendra Winner T and Kendra Winner
Current Estimated Value
Purchase Details
Closed on
Dec 1, 2004
Sold by
Ritchie Brian S and Ritchie Donna G
Bought by
Winner Kendra L and Mcelhinney Paul D
Home Financials for this Owner
Home Financials are based on the most recent Mortgage that was taken out on this home.
Original Mortgage
$435,000
Interest Rate
5.69%
Mortgage Type
Purchase Money Mortgage
Purchase Details
Closed on
Jul 11, 2002
Sold by
Bratton Vicky V
Bought by
Ritchie Brian S and Ritchie Donna G
Home Financials for this Owner
Home Financials are based on the most recent Mortgage that was taken out on this home.
Original Mortgage
$300,000
Interest Rate
6.79%
Mortgage Type
Purchase Money Mortgage
Purchase Details
Closed on
Jul 16, 1997
Sold by
Mcknight Mary F
Bought by
Bratton
Create a Home Valuation Report for This Property
The Home Valuation Report is an in-depth analysis detailing your home's value as well as a comparison with similar homes in the area
Home Values in the Area
Average Home Value in this Area
Purchase History
| Date | Buyer | Sale Price | Title Company |
|---|---|---|---|
| Kendra Winner T | -- | None Available | |
| Winner Kendra L | $715,000 | -- | |
| Ritchie Brian S | $646,500 | -- | |
| Bratton | $333,000 | -- |
Source: Public Records
Mortgage History
| Date | Status | Borrower | Loan Amount |
|---|---|---|---|
| Previous Owner | Winner Kendra L | $435,000 | |
| Previous Owner | Ritchie Brian S | $300,000 | |
| Previous Owner | Bratton | $275,000 | |
| Previous Owner | Bratton | $252,700 |
Source: Public Records
Tax History
| Year | Tax Paid | Tax Assessment Tax Assessment Total Assessment is a certain percentage of the fair market value that is determined by local assessors to be the total taxable value of land and additions on the property. | Land | Improvement |
|---|---|---|---|---|
| 2025 | $16,062 | $1,448,300 | $1,087,500 | $360,800 |
| 2024 | $15,586 | $1,375,600 | $1,055,500 | $320,100 |
| 2023 | $15,621 | $1,323,800 | $991,500 | $332,300 |
| 2022 | $15,141 | $1,210,300 | $895,600 | $314,700 |
| 2021 | $14,091 | $1,098,300 | $783,600 | $314,700 |
| 2020 | $13,608 | $1,098,300 | $783,600 | $314,700 |
| 2019 | $12,139 | $1,002,400 | $687,700 | $314,700 |
| 2018 | $10,267 | $977,500 | $671,700 | $305,800 |
| 2017 | $11,384 | $927,000 | $638,900 | $288,100 |
| 2016 | $10,725 | $918,200 | $638,900 | $279,300 |
| 2015 | $9,950 | $819,600 | $580,500 | $239,100 |
| 2014 | $9,604 | $758,600 | $527,800 | $230,800 |
Source: Public Records
Map
Nearby Homes
- 12 Yale St
- 45 Bacon St
- 27 Everett Ave
- 10 Sheffield W
- 6 Ivy Cir
- 9 Lakeview Terrace
- 9 Albamont Rd
- 89 Wildwood St
- 20 Grove Place
- 25 Myopia Rd
- 2 Canterbury Rd
- 4 Dartmouth St
- 61 Grove St
- 115 Washington St Unit 2A
- 62 Richardson St
- 200 Swanton St Unit 228
- 200 Swanton St Unit 636
- 200 Swanton St Unit T28
- 76 Woodside Rd
- 263 Highland Ave
Your Personal Tour Guide
Ask me questions while you tour the home.