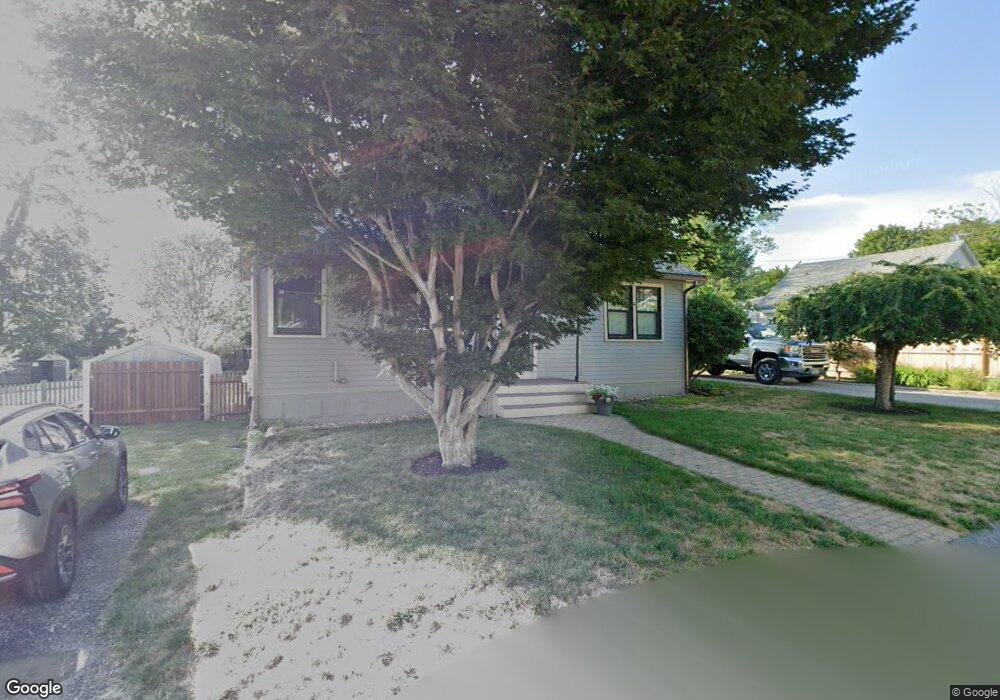
5 Lake Dr Littleton, MA 01460
Littleton Common NeighborhoodEstimated Value: $405,000 - $558,000
2
Beds
2
Baths
1,142
Sq Ft
$427/Sq Ft
Est. Value
About This Home
This home is located at 5 Lake Dr, Littleton, MA 01460 and is currently estimated at $487,997, approximately $427 per square foot. 5 Lake Dr is a home located in Middlesex County with nearby schools including Shaker Lane Elementary School, Russell Street Elementary School, and Littleton Middle School.
Ownership History
Date
Name
Owned For
Owner Type
Purchase Details
Closed on
Mar 21, 2012
Sold by
Littleton Town Of
Bought by
Whitcomb Tricia
Current Estimated Value
Create a Home Valuation Report for This Property
The Home Valuation Report is an in-depth analysis detailing your home's value as well as a comparison with similar homes in the area
Home Values in the Area
Average Home Value in this Area
Purchase History
| Date | Buyer | Sale Price | Title Company |
|---|---|---|---|
| Whitcomb Tricia | $4,612 | -- |
Source: Public Records
Tax History Compared to Growth
Tax History
| Year | Tax Paid | Tax Assessment Tax Assessment Total Assessment is a certain percentage of the fair market value that is determined by local assessors to be the total taxable value of land and additions on the property. | Land | Improvement |
|---|---|---|---|---|
| 2025 | $6,100 | $410,500 | $211,900 | $198,600 |
| 2024 | $5,274 | $355,400 | $211,900 | $143,500 |
| 2023 | $5,099 | $313,800 | $196,500 | $117,300 |
| 2022 | $5,111 | $288,600 | $188,800 | $99,800 |
| 2021 | $4,777 | $269,900 | $183,000 | $86,900 |
| 2020 | $4,423 | $248,900 | $162,100 | $86,800 |
| 2019 | $4,164 | $228,300 | $140,400 | $87,900 |
| 2018 | $4,025 | $221,900 | $140,400 | $81,500 |
| 2017 | $3,692 | $203,400 | $133,200 | $70,200 |
| 2016 | $3,595 | $203,200 | $133,200 | $70,000 |
| 2015 | $3,428 | $189,400 | $115,200 | $74,200 |
Source: Public Records
Map
Nearby Homes
- 16 Fletcher Ln
- 4 Mars Place
- 18 Long Lake Rd
- 115 Goldsmith St
- 35 Queen Rd
- 55 Jennifer St
- 34 Baldwin Hill Rd
- 12 Paula Beth St
- 8 Edsel Rd
- 10 Baldwin Hill Rd
- 336 King St Unit 105
- 146 Tahattawan Rd
- 305 Harwood Ave
- 84 Powers Rd
- 25 Grist Mill Rd
- 3 Mill Park Place
- 3 Mill Park Place Unit 3
- 5 Mill Park Place
- 5 Mill Park Place Unit 5
- 17 Hartwell Ave