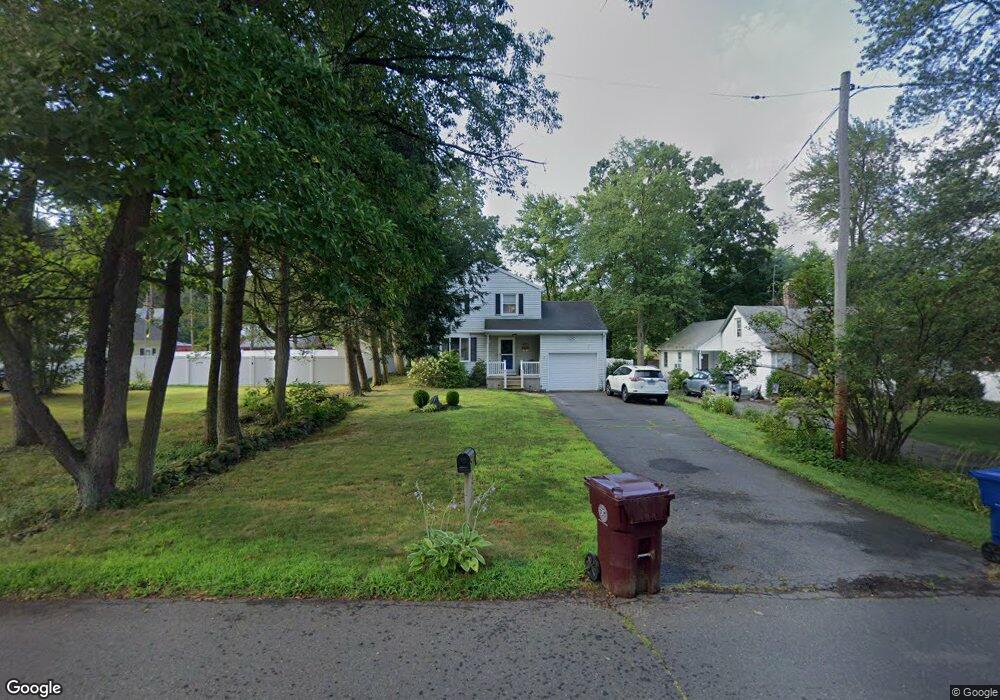
5 Lake Garda Dr Unionville, CT 06085
Estimated Value: $382,000 - $413,000
3
Beds
2
Baths
1,209
Sq Ft
$330/Sq Ft
Est. Value
About This Home
This home is located at 5 Lake Garda Dr, Unionville, CT 06085 and is currently estimated at $398,481, approximately $329 per square foot. 5 Lake Garda Dr is a home located in Hartford County with nearby schools including West Woods Upper Elementary School, Irving A. Robbins Middle School, and Farmington High School.
Ownership History
Date
Name
Owned For
Owner Type
Purchase Details
Closed on
Jun 28, 2010
Sold by
Pray Devin P
Bought by
Forristall Ashley L
Current Estimated Value
Home Financials for this Owner
Home Financials are based on the most recent Mortgage that was taken out on this home.
Original Mortgage
$176,000
Outstanding Balance
$118,465
Interest Rate
4.98%
Estimated Equity
$280,016
Purchase Details
Closed on
Jun 23, 2005
Sold by
Quigley James F and Quigley Dianne M
Bought by
Pray Devin P
Purchase Details
Closed on
May 31, 2002
Sold by
Zelasko Slawomir and Zelasko Jody L
Bought by
Quigley James F and Quigley Dianne M
Purchase Details
Closed on
Nov 24, 1999
Sold by
Uarych Elizabeth
Bought by
Zelasko Slawomir and Zelasko Jody L
Purchase Details
Closed on
Apr 12, 1996
Sold by
Tarascio John
Bought by
Uarych Elizabeth
Create a Home Valuation Report for This Property
The Home Valuation Report is an in-depth analysis detailing your home's value as well as a comparison with similar homes in the area
Home Values in the Area
Average Home Value in this Area
Purchase History
| Date | Buyer | Sale Price | Title Company |
|---|---|---|---|
| Forristall Ashley L | $220,000 | -- | |
| Pray Devin P | $238,000 | -- | |
| Quigley James F | $174,000 | -- | |
| Zelasko Slawomir | $140,000 | -- | |
| Uarych Elizabeth | $122,000 | -- |
Source: Public Records
Mortgage History
| Date | Status | Borrower | Loan Amount |
|---|---|---|---|
| Open | Uarych Elizabeth | $176,000 | |
| Previous Owner | Uarych Elizabeth | $21,000 |
Source: Public Records
Tax History Compared to Growth
Tax History
| Year | Tax Paid | Tax Assessment Tax Assessment Total Assessment is a certain percentage of the fair market value that is determined by local assessors to be the total taxable value of land and additions on the property. | Land | Improvement |
|---|---|---|---|---|
| 2025 | $5,300 | $199,080 | $72,940 | $126,140 |
| 2024 | $5,067 | $199,080 | $72,940 | $126,140 |
| 2023 | $4,820 | $199,080 | $72,940 | $126,140 |
| 2022 | $4,577 | $156,110 | $66,330 | $89,780 |
| 2021 | $4,498 | $156,110 | $66,330 | $89,780 |
| 2020 | $4,366 | $156,110 | $66,330 | $89,780 |
| 2019 | $4,366 | $156,110 | $66,330 | $89,780 |
| 2018 | $4,243 | $156,110 | $66,330 | $89,780 |
| 2017 | $4,055 | $151,970 | $61,710 | $90,260 |
| 2016 | $3,918 | $151,970 | $61,710 | $90,260 |
| 2015 | $3,801 | $151,970 | $61,710 | $90,260 |
| 2014 | $3,715 | $152,000 | $61,740 | $90,260 |
Source: Public Records
Map
Nearby Homes
- 487 Plainville Ave
- 61 Litchfield Rd
- 69 Lake Garda Dr
- 10 Woodside Dr
- 50 E Shore Blvd
- 17 Pine Dr
- 6 Burlington Rd
- 27 Westview Terrace
- 16 Strong St
- 54 Westview Terrace
- 20 Farm Dr
- 220 Monce Rd Unit 17
- 55 Depot Place
- 7 Newcastle Place
- 31 Railroad Ave
- 243 New Britain Ave Unit 243
- 4 Sable Ct Unit 4
- 267 New Britain Ave
- 86 Alpine Dr
- 148 River Rd
- 5 Lake Garda Dr
- 7 Lake Garda Dr
- 8 Lake Garda Dr
- 9 Lake Garda Dr
- 477 Plainville Ave
- 482 Plainville Ave
- 5 Litchfield Rd
- 470 Plainville Ave
- 471 Plainville Ave
- 12 Lake Garda Dr
- 12 Lake Garda Dr
- 7 Litchfield Rd
- 465 Plainville Ave
- 16 Lake Garda Dr
- 9 Litchfield Rd
- 465 Plainville Ave
- 6 Litchfield Rd
- 2 Sunset Dr
- 11 Litchfield Rd