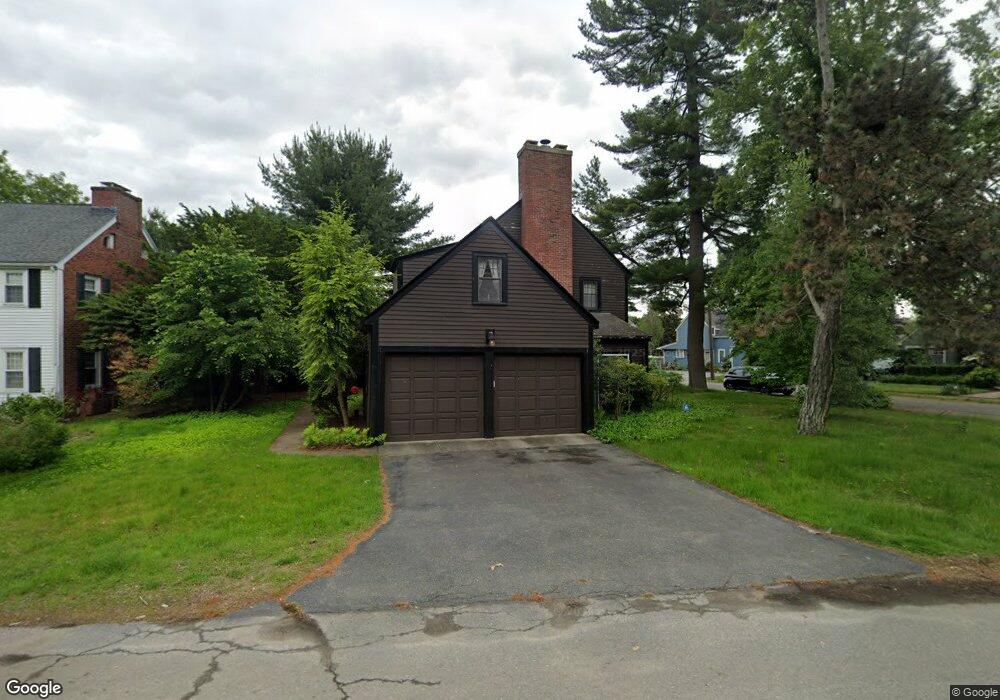
5 Lakeview Dr Lynnfield, MA 01940
Estimated Value: $751,000 - $818,000
3
Beds
2
Baths
1,804
Sq Ft
$435/Sq Ft
Est. Value
About This Home
This home is located at 5 Lakeview Dr, Lynnfield, MA 01940 and is currently estimated at $784,385, approximately $434 per square foot. 5 Lakeview Dr is a home located in Essex County with nearby schools including Lynnfield Middle School, Pickering Middle School, and Lynnfield High School.
Ownership History
Date
Name
Owned For
Owner Type
Purchase Details
Closed on
Jan 15, 2020
Sold by
Becker Robert C
Bought by
Becker Ft
Current Estimated Value
Purchase Details
Closed on
Jan 28, 2016
Sold by
Becker Robert C and Fairweather Brenda J
Bought by
Becker Robert C
Home Financials for this Owner
Home Financials are based on the most recent Mortgage that was taken out on this home.
Original Mortgage
$142,000
Interest Rate
3.97%
Mortgage Type
New Conventional
Purchase Details
Closed on
May 5, 2014
Sold by
Beacker Nt and Becker Robert C
Bought by
Becker Robert C and Fairweather Brenda J
Home Financials for this Owner
Home Financials are based on the most recent Mortgage that was taken out on this home.
Original Mortgage
$150,000
Interest Rate
4%
Mortgage Type
Adjustable Rate Mortgage/ARM
Purchase Details
Closed on
Nov 10, 2003
Sold by
Becker Laura
Bought by
Becker Nt
Create a Home Valuation Report for This Property
The Home Valuation Report is an in-depth analysis detailing your home's value as well as a comparison with similar homes in the area
Home Values in the Area
Average Home Value in this Area
Purchase History
| Date | Buyer | Sale Price | Title Company |
|---|---|---|---|
| Becker Ft | -- | None Available | |
| Becker Robert C | -- | -- | |
| Becker Robert C | -- | -- | |
| Becker Nt | -- | -- |
Source: Public Records
Mortgage History
| Date | Status | Borrower | Loan Amount |
|---|---|---|---|
| Previous Owner | Becker Robert C | $142,000 | |
| Previous Owner | Becker Robert C | $150,000 |
Source: Public Records
Tax History Compared to Growth
Tax History
| Year | Tax Paid | Tax Assessment Tax Assessment Total Assessment is a certain percentage of the fair market value that is determined by local assessors to be the total taxable value of land and additions on the property. | Land | Improvement |
|---|---|---|---|---|
| 2025 | $7,272 | $688,600 | $367,300 | $321,300 |
| 2024 | $6,579 | $626,000 | $333,900 | $292,100 |
| 2023 | $6,491 | $574,400 | $316,800 | $257,600 |
| 2022 | $6,320 | $527,100 | $303,600 | $223,500 |
| 2021 | $6,010 | $452,900 | $242,900 | $210,000 |
| 2020 | $5,863 | $421,200 | $211,200 | $210,000 |
| 2019 | $5,859 | $421,200 | $211,200 | $210,000 |
| 2018 | $5,796 | $421,200 | $211,200 | $210,000 |
| 2017 | $5,622 | $408,000 | $198,000 | $210,000 |
| 2016 | $5,787 | $399,100 | $188,700 | $210,400 |
| 2015 | $5,780 | $398,900 | $188,500 | $210,400 |
Source: Public Records
Map
Nearby Homes
- 807 Salem St
- 1 Ingalls Terrace
- 37 Locust St
- 67 Brook Dr
- 344 Broadway
- 5 Otter Pond Rd
- 14 Carpenter Rd
- 6 Longbow Rd
- 1100 Salem St Unit 58
- 1100 Salem St Unit 46
- 1100 Salem St Unit 93
- 1100 Salem St Unit 75
- 12 Casco Rd
- 7 Timberhill Ln
- 63 Crooker Dr
- 10 Ralph Rd
- 159 Judge Rd
- 714 Lynnfield St
- 1303 Foxwood Cir
- 1301 Foxwood Cir Unit 1301