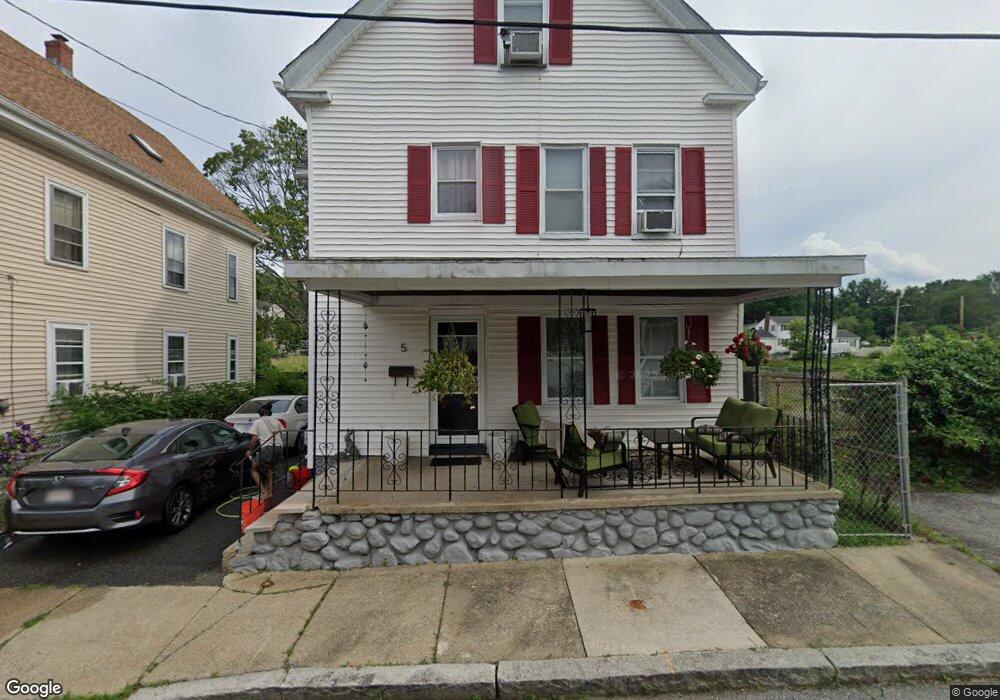
5 Langdon St Salem, MA 01970
Gallows Hill NeighborhoodEstimated Value: $570,183 - $645,000
3
Beds
2
Baths
1,925
Sq Ft
$311/Sq Ft
Est. Value
About This Home
This home is located at 5 Langdon St, Salem, MA 01970 and is currently estimated at $599,546, approximately $311 per square foot. 5 Langdon St is a home located in Essex County with nearby schools including Horace Mann Laboratory, Witchcraft Heights Elementary School, and Saltonstall School.
Ownership History
Date
Name
Owned For
Owner Type
Purchase Details
Closed on
May 1, 2008
Sold by
Calderon Sorangel
Bought by
Almonte Luz M and Vigneault Denis
Current Estimated Value
Home Financials for this Owner
Home Financials are based on the most recent Mortgage that was taken out on this home.
Original Mortgage
$230,483
Interest Rate
5.99%
Mortgage Type
Purchase Money Mortgage
Purchase Details
Closed on
Feb 1, 2006
Sold by
Dones Felix and Oquendo Iris
Bought by
Calderon Sorangel
Home Financials for this Owner
Home Financials are based on the most recent Mortgage that was taken out on this home.
Original Mortgage
$273,600
Interest Rate
6.31%
Mortgage Type
Purchase Money Mortgage
Create a Home Valuation Report for This Property
The Home Valuation Report is an in-depth analysis detailing your home's value as well as a comparison with similar homes in the area
Home Values in the Area
Average Home Value in this Area
Purchase History
| Date | Buyer | Sale Price | Title Company |
|---|---|---|---|
| Almonte Luz M | $234,100 | -- | |
| Calderon Sorangel | $342,000 | -- |
Source: Public Records
Mortgage History
| Date | Status | Borrower | Loan Amount |
|---|---|---|---|
| Open | Calderon Sorangel | $228,720 | |
| Closed | Calderon Sorangel | $230,483 | |
| Previous Owner | Calderon Sorangel | $273,600 | |
| Previous Owner | Calderon Sorangel | $68,400 |
Source: Public Records
Tax History
| Year | Tax Paid | Tax Assessment Tax Assessment Total Assessment is a certain percentage of the fair market value that is determined by local assessors to be the total taxable value of land and additions on the property. | Land | Improvement |
|---|---|---|---|---|
| 2025 | $6,050 | $533,500 | $194,900 | $338,600 |
| 2024 | $5,856 | $504,000 | $185,300 | $318,700 |
| 2023 | $5,614 | $448,800 | $171,000 | $277,800 |
| 2022 | $5,521 | $416,700 | $165,300 | $251,400 |
| 2021 | $5,434 | $393,800 | $153,900 | $239,900 |
| 2020 | $5,251 | $363,400 | $145,400 | $218,000 |
| 2019 | $5,223 | $345,900 | $137,900 | $208,000 |
| 2018 | $5,062 | $329,100 | $131,100 | $198,000 |
| 2017 | $4,603 | $290,200 | $110,600 | $179,600 |
| 2016 | $4,468 | $285,100 | $105,500 | $179,600 |
| 2015 | $4,367 | $266,100 | $96,900 | $169,200 |
Source: Public Records
Map
Nearby Homes
- 3 Langdon St
- 1 Langdon St
- 36 Proctor St
- 2 Langdon St
- 4 Langdon St
- 6 Langdon St
- 105 Langdon St
- 34 Proctor St
- 37 Proctor St
- 8 Langdon St
- 35 Proctor St
- 14 Langdon St Unit 14 Langdon St
- 32 Proctor St
- 12 Langdon St Unit 14
- 10 Langdon St
- 10 1/2 Langdon St
- 10 1/2 Langdon St Unit 3
- 43 Proctor St
- 41 Proctor St
- 19 Pope St
Your Personal Tour Guide
Ask me questions while you tour the home.