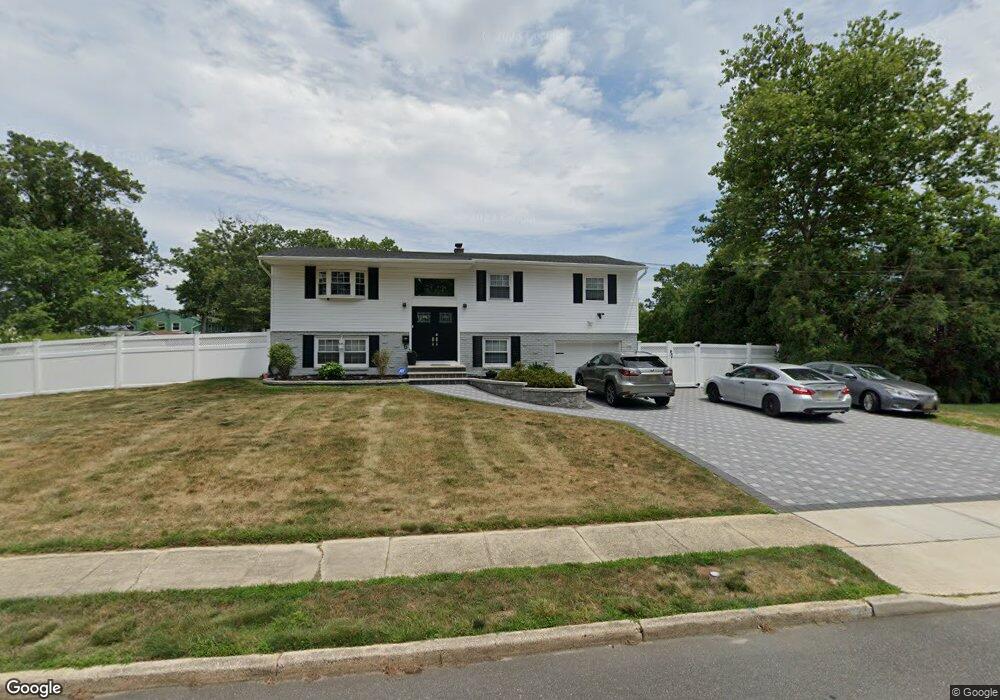
5 Laurel Ct Howell, NJ 07731
Candlewood NeighborhoodEstimated Value: $557,000 - $583,000
3
Beds
2
Baths
2,012
Sq Ft
$284/Sq Ft
Est. Value
About This Home
This home is located at 5 Laurel Ct, Howell, NJ 07731 and is currently estimated at $571,476, approximately $284 per square foot. 5 Laurel Ct is a home located in Monmouth County with nearby schools including Land O' Pines School, Newbury School, and Howell Middle School North.
Ownership History
Date
Name
Owned For
Owner Type
Purchase Details
Closed on
Jun 22, 2015
Sold by
Fannie Mae
Bought by
Chenault Kaaba and Mccrimon Khalilah
Current Estimated Value
Home Financials for this Owner
Home Financials are based on the most recent Mortgage that was taken out on this home.
Original Mortgage
$271,389
Interest Rate
3.75%
Mortgage Type
FHA
Purchase Details
Closed on
May 24, 2014
Sold by
Nigro Christopher and Nigro Christine
Bought by
Federal National Mortgage Association
Purchase Details
Closed on
Nov 29, 2000
Sold by
Schuetz Robert
Bought by
Nigro Christopher and Nigro Christine
Home Financials for this Owner
Home Financials are based on the most recent Mortgage that was taken out on this home.
Original Mortgage
$184,300
Interest Rate
7.14%
Create a Home Valuation Report for This Property
The Home Valuation Report is an in-depth analysis detailing your home's value as well as a comparison with similar homes in the area
Home Values in the Area
Average Home Value in this Area
Purchase History
| Date | Buyer | Sale Price | Title Company |
|---|---|---|---|
| Chenault Kaaba | $240,000 | Weichert Title Agency | |
| Federal National Mortgage Association | $287,000 | Old Republic Title Ris | |
| Nigro Christopher | $190,000 | -- |
Source: Public Records
Mortgage History
| Date | Status | Borrower | Loan Amount |
|---|---|---|---|
| Previous Owner | Chenault Kaaba | $271,389 | |
| Previous Owner | Nigro Christopher | $184,300 |
Source: Public Records
Tax History
| Year | Tax Paid | Tax Assessment Tax Assessment Total Assessment is a certain percentage of the fair market value that is determined by local assessors to be the total taxable value of land and additions on the property. | Land | Improvement |
|---|---|---|---|---|
| 2025 | $8,161 | $435,600 | $187,200 | $248,400 |
| 2024 | $7,857 | $459,000 | $215,200 | $243,800 |
Source: Public Records
Map
Nearby Homes
Your Personal Tour Guide
Ask me questions while you tour the home.