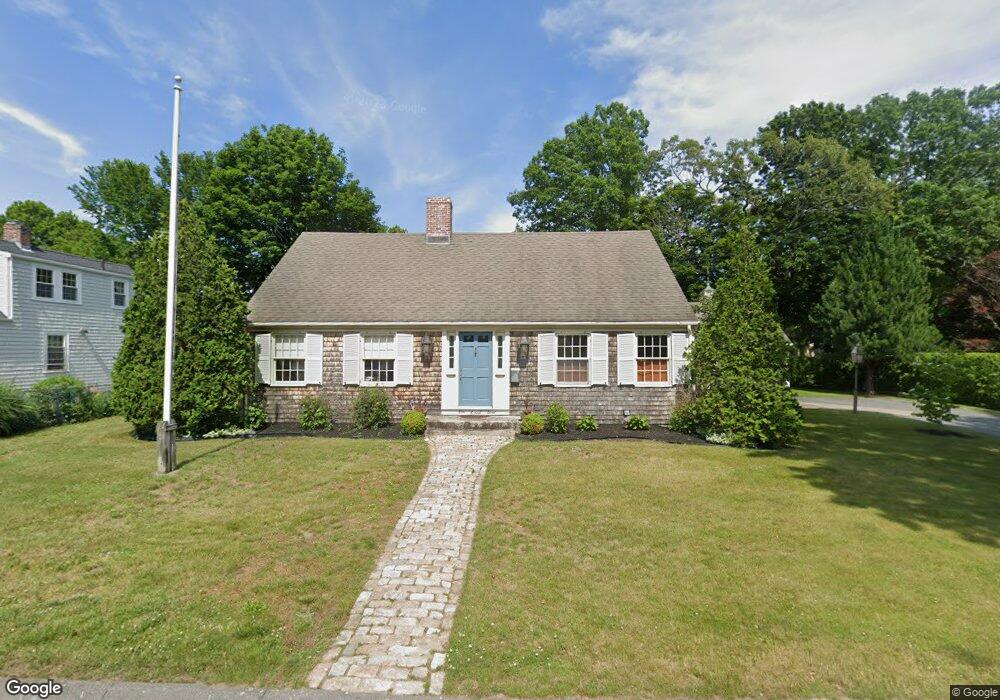
5 Laurel St Fairhaven, MA 02719
Estimated Value: $548,000 - $966,000
4
Beds
2
Baths
2,546
Sq Ft
$283/Sq Ft
Est. Value
About This Home
This home is located at 5 Laurel St, Fairhaven, MA 02719 and is currently estimated at $721,015, approximately $283 per square foot. 5 Laurel St is a home located in Bristol County with nearby schools including Fairhaven High School, City On A Hill Charter Public School New Bedford, and St. Joseph School.
Ownership History
Date
Name
Owned For
Owner Type
Purchase Details
Closed on
May 31, 2024
Sold by
Sovik Sonha
Bought by
Sonja Sovik Ret and Sovik
Current Estimated Value
Purchase Details
Closed on
Jul 10, 1996
Sold by
Entin Stephen J
Bought by
Medeiros David J and Medeieros Beth
Home Financials for this Owner
Home Financials are based on the most recent Mortgage that was taken out on this home.
Original Mortgage
$65,000
Interest Rate
7.98%
Mortgage Type
Purchase Money Mortgage
Create a Home Valuation Report for This Property
The Home Valuation Report is an in-depth analysis detailing your home's value as well as a comparison with similar homes in the area
Home Values in the Area
Average Home Value in this Area
Purchase History
| Date | Buyer | Sale Price | Title Company |
|---|---|---|---|
| Sonja Sovik Ret | -- | None Available | |
| Sonja Sovik Ret | -- | None Available | |
| Medeiros David J | $107,000 | -- | |
| Medeiros David J | $107,000 | -- |
Source: Public Records
Mortgage History
| Date | Status | Borrower | Loan Amount |
|---|---|---|---|
| Previous Owner | Medeiros David J | $25,000 | |
| Previous Owner | Medeiros David J | $65,000 |
Source: Public Records
Tax History Compared to Growth
Tax History
| Year | Tax Paid | Tax Assessment Tax Assessment Total Assessment is a certain percentage of the fair market value that is determined by local assessors to be the total taxable value of land and additions on the property. | Land | Improvement |
|---|---|---|---|---|
| 2025 | $48 | $516,800 | $248,500 | $268,300 |
| 2024 | $4,633 | $501,900 | $248,500 | $253,400 |
| 2023 | $4,291 | $431,300 | $214,400 | $216,900 |
| 2022 | $4,113 | $402,400 | $195,200 | $207,200 |
| 2021 | $0 | $357,800 | $177,500 | $180,300 |
| 2020 | $3,957 | $357,800 | $177,500 | $180,300 |
| 2019 | $3,792 | $324,900 | $152,100 | $172,800 |
| 2018 | $0 | $310,300 | $144,700 | $165,600 |
| 2017 | $0 | $302,800 | $139,300 | $163,500 |
| 2016 | $3,606 | $296,100 | $136,500 | $159,600 |
| 2015 | $3,432 | $282,500 | $136,500 | $146,000 |
Source: Public Records
Map
Nearby Homes