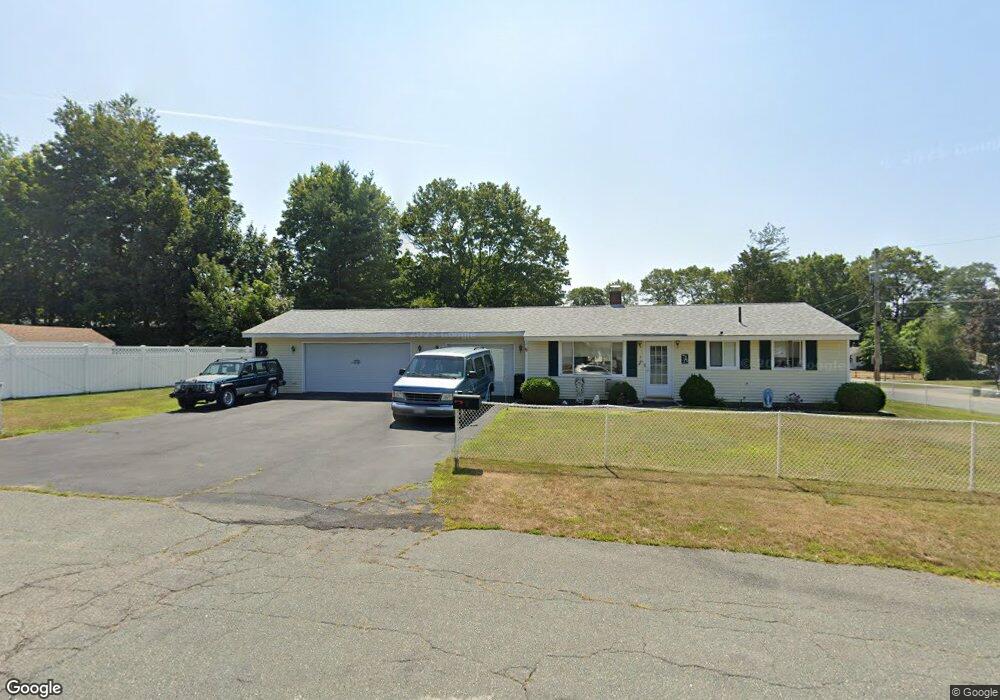
5 Leland St Brockton, MA 02302
Estimated Value: $373,000 - $423,000
3
Beds
1
Bath
864
Sq Ft
$463/Sq Ft
Est. Value
About This Home
This home is located at 5 Leland St, Brockton, MA 02302 and is currently estimated at $400,385, approximately $463 per square foot. 5 Leland St is a home located in Plymouth County with nearby schools including Brookfield Elementary School, Mary E. Baker Elementary School, and Downey Elementary School.
Ownership History
Date
Name
Owned For
Owner Type
Purchase Details
Closed on
Jun 1, 1992
Sold by
Randolph Sb
Bought by
Murphy Laura T
Current Estimated Value
Purchase Details
Closed on
Jan 29, 1992
Sold by
Coan Clyde W
Bought by
Randolph Sb
Purchase Details
Closed on
Jan 16, 1992
Sold by
Coan Clyde W
Bought by
Randolph Sb
Create a Home Valuation Report for This Property
The Home Valuation Report is an in-depth analysis detailing your home's value as well as a comparison with similar homes in the area
Home Values in the Area
Average Home Value in this Area
Purchase History
| Date | Buyer | Sale Price | Title Company |
|---|---|---|---|
| Murphy Laura T | $80,000 | -- | |
| Randolph Sb | $38,000 | -- | |
| Randolph Sb | $38,000 | -- |
Source: Public Records
Mortgage History
| Date | Status | Borrower | Loan Amount |
|---|---|---|---|
| Open | Randolph Sb | $207,750 | |
| Closed | Randolph Sb | $23,000 |
Source: Public Records
Tax History Compared to Growth
Tax History
| Year | Tax Paid | Tax Assessment Tax Assessment Total Assessment is a certain percentage of the fair market value that is determined by local assessors to be the total taxable value of land and additions on the property. | Land | Improvement |
|---|---|---|---|---|
| 2025 | $4,347 | $359,000 | $146,500 | $212,500 |
| 2024 | $4,282 | $356,200 | $146,500 | $209,700 |
| 2023 | $4,352 | $335,300 | $111,500 | $223,800 |
| 2022 | $4,141 | $296,400 | $101,500 | $194,900 |
| 2021 | $4,046 | $279,000 | $95,900 | $183,100 |
| 2020 | $3,915 | $258,400 | $91,900 | $166,500 |
| 2019 | $3,767 | $242,400 | $86,200 | $156,200 |
| 2018 | $3,357 | $209,000 | $86,200 | $122,800 |
| 2017 | $3,038 | $188,700 | $86,200 | $102,500 |
| 2016 | $2,998 | $172,700 | $82,300 | $90,400 |
| 2015 | $2,479 | $136,600 | $82,300 | $54,300 |
| 2014 | $2,277 | $125,600 | $82,300 | $43,300 |
Source: Public Records
Map
Nearby Homes
- 15 Quincy St
- 9 Massachusetts Ave
- 590 E Ashland St
- 65 Leahy Rd
- 21 Annette Rd
- 76 Quincy St Unit Lot 1
- 92 Debbie Rd Unit Lot 17
- 499 E Ashland St
- 232 Bates Rd
- 209 Bates Rd
- 24 Oberlin Rd
- 92 Gloucester St
- 43 Pinehurst Ave
- 1002 Court St
- 10 Exeter St
- 129 Anawan St
- 97 Waleco Rd
- 31 Pontiac Rd
- 146 Gloucester St
- 2 Dundee St