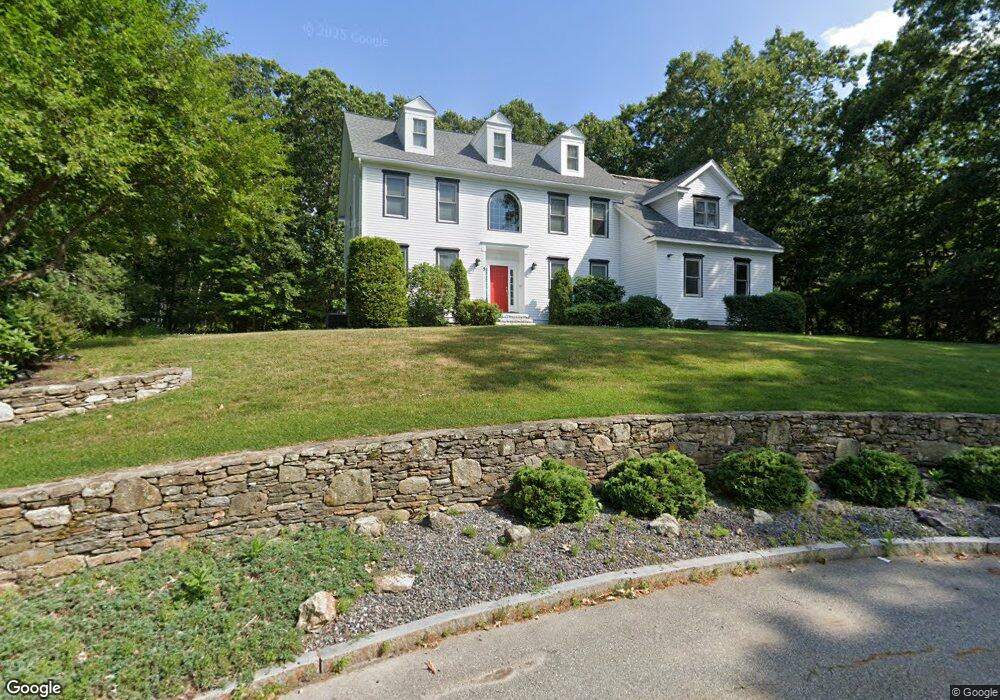
5 Libby Rd Natick, MA 01760
Estimated Value: $1,712,181 - $1,892,000
4
Beds
4
Baths
3,692
Sq Ft
$479/Sq Ft
Est. Value
About This Home
This home is located at 5 Libby Rd, Natick, MA 01760 and is currently estimated at $1,770,045, approximately $479 per square foot. 5 Libby Rd is a home located in Middlesex County with nearby schools including Natick High School, Memorial Elementary School, and J F Kennedy Middle School.
Ownership History
Date
Name
Owned For
Owner Type
Purchase Details
Closed on
Oct 11, 2000
Sold by
Barberry Homes Inc
Bought by
Tsai Hatty
Current Estimated Value
Home Financials for this Owner
Home Financials are based on the most recent Mortgage that was taken out on this home.
Original Mortgage
$250,000
Outstanding Balance
$90,977
Interest Rate
7.89%
Mortgage Type
Purchase Money Mortgage
Estimated Equity
$1,679,068
Create a Home Valuation Report for This Property
The Home Valuation Report is an in-depth analysis detailing your home's value as well as a comparison with similar homes in the area
Home Values in the Area
Average Home Value in this Area
Purchase History
| Date | Buyer | Sale Price | Title Company |
|---|---|---|---|
| Tsai Hatty | $695,000 | -- |
Source: Public Records
Mortgage History
| Date | Status | Borrower | Loan Amount |
|---|---|---|---|
| Open | Tsai Hatty | $250,000 |
Source: Public Records
Tax History
| Year | Tax Paid | Tax Assessment Tax Assessment Total Assessment is a certain percentage of the fair market value that is determined by local assessors to be the total taxable value of land and additions on the property. | Land | Improvement |
|---|---|---|---|---|
| 2025 | $17,959 | $1,501,600 | $562,900 | $938,700 |
| 2024 | $17,387 | $1,418,200 | $533,300 | $884,900 |
| 2023 | $16,431 | $1,299,900 | $533,300 | $766,600 |
| 2022 | $15,566 | $1,166,900 | $436,100 | $730,800 |
| 2021 | $15,133 | $1,111,900 | $430,300 | $681,600 |
| 2020 | $14,899 | $1,094,700 | $413,100 | $681,600 |
| 2019 | $13,914 | $1,094,700 | $413,100 | $681,600 |
| 2018 | $13,552 | $1,038,500 | $399,600 | $638,900 |
| 2017 | $13,772 | $1,020,900 | $393,600 | $627,300 |
| 2016 | $13,776 | $1,015,200 | $393,600 | $621,600 |
| 2015 | $13,224 | $956,900 | $393,600 | $563,300 |
Source: Public Records
Map
Nearby Homes
- 2 Arrow Path
- 165 Woodland St
- 81 Woodland St
- 48 Algonquian Dr
- 104 Eliot St
- 83 Eliot St
- 11 Avon St
- 67 E Central St & 5 Union St
- 29 Water St
- 189 Eliot St
- 5 Wilson St Unit 5A
- 3A Wilson St Unit 3A
- 6A Lincoln St Unit 6A
- 192 Pond Rd
- 4B Lincoln St Unit 4B
- 3 Wilson St Unit 3B
- 34 Marion St
- 3 Vale St Unit A
- 53 Harvard Street Extension
- 8 Floral Ave Unit 8
Your Personal Tour Guide
Ask me questions while you tour the home.