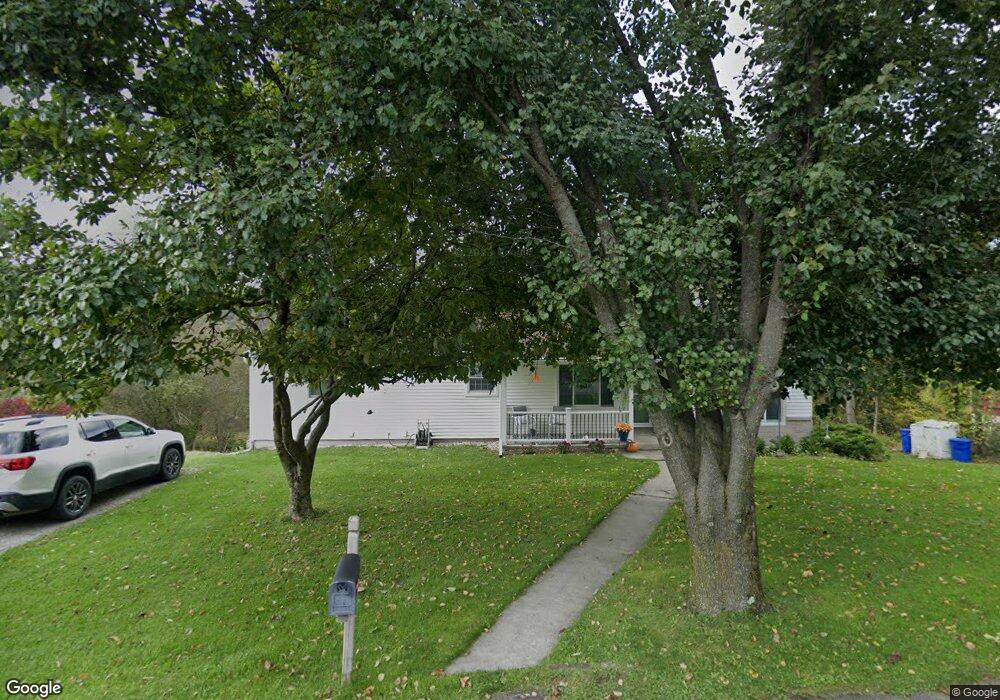
5 Lillian Dr Binghamton, NY 13903
Estimated Value: $141,000 - $196,000
3
Beds
1
Bath
1,272
Sq Ft
$134/Sq Ft
Est. Value
About This Home
This home is located at 5 Lillian Dr, Binghamton, NY 13903 and is currently estimated at $171,052, approximately $134 per square foot. 5 Lillian Dr is a home located in Broome County with nearby schools including Susquehanna Valley High School, St. John the Evangelist School, and Seton Catholic Central High School.
Ownership History
Date
Name
Owned For
Owner Type
Purchase Details
Closed on
Jul 28, 2011
Sold by
Hierl Robert
Bought by
Nabinger Garry R
Current Estimated Value
Home Financials for this Owner
Home Financials are based on the most recent Mortgage that was taken out on this home.
Original Mortgage
$90,395
Interest Rate
4.25%
Mortgage Type
FHA
Purchase Details
Closed on
Nov 17, 2010
Sold by
Manufacturers & Traders Trust Company
Bought by
Hierl Robert
Purchase Details
Closed on
Jan 19, 2010
Sold by
Clark Eleanore G
Bought by
Manufacturers & Traders Trust Company
Create a Home Valuation Report for This Property
The Home Valuation Report is an in-depth analysis detailing your home's value as well as a comparison with similar homes in the area
Home Values in the Area
Average Home Value in this Area
Purchase History
| Date | Buyer | Sale Price | Title Company |
|---|---|---|---|
| Nabinger Garry R | $100,000 | None Available | |
| Hierl Robert | $34,500 | None Available | |
| Manufacturers & Traders Trust Company | $68,560 | None Available |
Source: Public Records
Mortgage History
| Date | Status | Borrower | Loan Amount |
|---|---|---|---|
| Previous Owner | Nabinger Garry R | $90,395 |
Source: Public Records
Tax History Compared to Growth
Tax History
| Year | Tax Paid | Tax Assessment Tax Assessment Total Assessment is a certain percentage of the fair market value that is determined by local assessors to be the total taxable value of land and additions on the property. | Land | Improvement |
|---|---|---|---|---|
| 2024 | $5,492 | $75,000 | $18,400 | $56,600 |
| 2023 | $5,482 | $75,000 | $18,400 | $56,600 |
| 2022 | $5,531 | $75,000 | $18,400 | $56,600 |
| 2021 | $5,420 | $75,000 | $18,400 | $56,600 |
| 2020 | $4,616 | $75,000 | $18,400 | $56,600 |
| 2019 | -- | $75,000 | $18,400 | $56,600 |
| 2018 | $4,541 | $75,000 | $18,400 | $56,600 |
| 2017 | $4,658 | $75,000 | $18,400 | $56,600 |
| 2016 | $4,486 | $75,000 | $18,400 | $56,600 |
| 2015 | -- | $75,000 | $18,400 | $56,600 |
| 2014 | -- | $75,000 | $18,400 | $56,600 |
Source: Public Records
Map
Nearby Homes