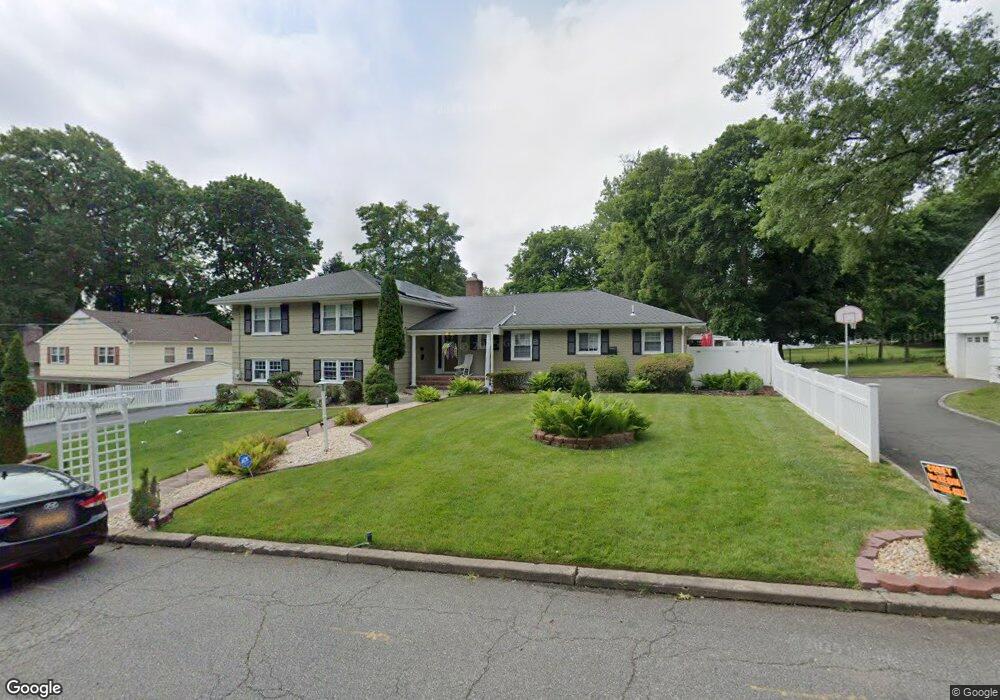
5 Linden Ct West Orange, NJ 07052
Estimated Value: $736,000 - $1,007,000
--
Bed
--
Bath
2,947
Sq Ft
$286/Sq Ft
Est. Value
About This Home
This home is located at 5 Linden Ct, West Orange, NJ 07052 and is currently estimated at $842,713, approximately $285 per square foot. 5 Linden Ct is a home located in Essex County with nearby schools including West Orange High School and Golda Och Academy Lower School.
Ownership History
Date
Name
Owned For
Owner Type
Purchase Details
Closed on
Jan 26, 2000
Sold by
City Of Orange
Bought by
Jacksons Construction
Current Estimated Value
Purchase Details
Closed on
Sep 20, 1996
Sold by
Tichenor Albert
Bought by
Brown Maritza
Home Financials for this Owner
Home Financials are based on the most recent Mortgage that was taken out on this home.
Original Mortgage
$176,000
Interest Rate
8.22%
Create a Home Valuation Report for This Property
The Home Valuation Report is an in-depth analysis detailing your home's value as well as a comparison with similar homes in the area
Home Values in the Area
Average Home Value in this Area
Purchase History
| Date | Buyer | Sale Price | Title Company |
|---|---|---|---|
| Jacksons Construction | $23,000 | -- | |
| Brown Maritza | $220,000 | -- |
Source: Public Records
Mortgage History
| Date | Status | Borrower | Loan Amount |
|---|---|---|---|
| Previous Owner | Brown Maritza | $176,000 |
Source: Public Records
Tax History Compared to Growth
Tax History
| Year | Tax Paid | Tax Assessment Tax Assessment Total Assessment is a certain percentage of the fair market value that is determined by local assessors to be the total taxable value of land and additions on the property. | Land | Improvement |
|---|---|---|---|---|
| 2025 | $19,183 | $769,600 | $313,100 | $456,500 |
| 2024 | $19,183 | $417,200 | $135,800 | $281,400 |
| 2022 | $18,511 | $417,200 | $135,800 | $281,400 |
| 2021 | $18,165 | $417,200 | $135,800 | $281,400 |
| 2020 | $17,873 | $417,200 | $135,800 | $281,400 |
| 2019 | $17,360 | $417,200 | $135,800 | $281,400 |
| 2018 | $16,847 | $417,200 | $135,800 | $281,400 |
| 2017 | $16,630 | $417,200 | $135,800 | $281,400 |
| 2016 | $16,229 | $417,200 | $135,800 | $281,400 |
| 2015 | $15,925 | $417,200 | $135,800 | $281,400 |
| 2014 | $15,612 | $417,200 | $135,800 | $281,400 |
Source: Public Records
Map
Nearby Homes