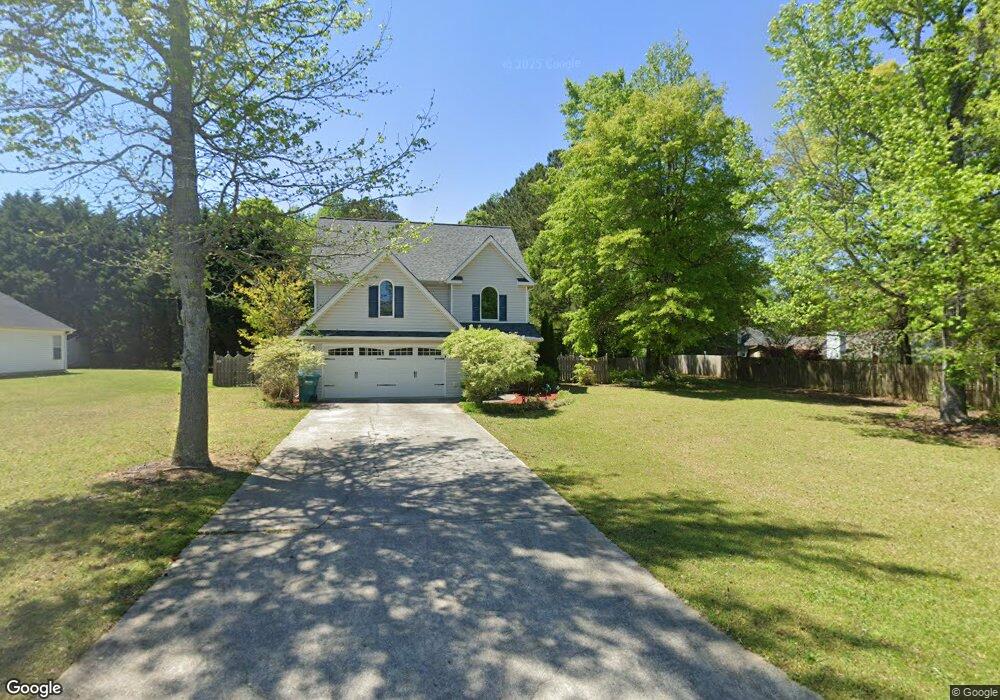
5 Lindsey Ln Unit 3B Hampton, GA 30228
Estimated Value: $259,000 - $273,000
3
Beds
3
Baths
1,730
Sq Ft
$152/Sq Ft
Est. Value
About This Home
This home is located at 5 Lindsey Ln Unit 3B, Hampton, GA 30228 and is currently estimated at $263,743, approximately $152 per square foot. 5 Lindsey Ln Unit 3B is a home located in Henry County with nearby schools including Hampton Elementary School, Hampton Middle School, and Hampton High School.
Ownership History
Date
Name
Owned For
Owner Type
Purchase Details
Closed on
Jul 20, 2015
Sold by
Holcomb Brandon
Bought by
Rogers Tolanda and Rogers Derrick
Current Estimated Value
Home Financials for this Owner
Home Financials are based on the most recent Mortgage that was taken out on this home.
Original Mortgage
$118,750
Outstanding Balance
$93,173
Interest Rate
4.04%
Mortgage Type
New Conventional
Estimated Equity
$170,570
Purchase Details
Closed on
Apr 3, 2008
Sold by
Hsbc Bank Usa
Bought by
Holcomb Brandon
Home Financials for this Owner
Home Financials are based on the most recent Mortgage that was taken out on this home.
Original Mortgage
$106,000
Interest Rate
5.84%
Mortgage Type
VA
Purchase Details
Closed on
Aug 7, 2007
Sold by
Athearn Glrnn J
Bought by
Hsbc Bk Usa
Purchase Details
Closed on
Aug 30, 2002
Sold by
Glenn Willard Hms Inc
Bought by
Hembree Phillip J
Home Financials for this Owner
Home Financials are based on the most recent Mortgage that was taken out on this home.
Original Mortgage
$123,119
Interest Rate
6.18%
Mortgage Type
FHA
Create a Home Valuation Report for This Property
The Home Valuation Report is an in-depth analysis detailing your home's value as well as a comparison with similar homes in the area
Home Values in the Area
Average Home Value in this Area
Purchase History
| Date | Buyer | Sale Price | Title Company |
|---|---|---|---|
| Rogers Tolanda | $125,000 | -- | |
| Holcomb Brandon | $106,000 | -- | |
| Hsbc Bk Usa | $138,726 | -- | |
| Hembree Phillip J | $124,100 | -- |
Source: Public Records
Mortgage History
| Date | Status | Borrower | Loan Amount |
|---|---|---|---|
| Open | Rogers Tolanda | $118,750 | |
| Previous Owner | Holcomb Brandon | $106,000 | |
| Previous Owner | Hembree Phillip J | $123,119 |
Source: Public Records
Tax History
| Year | Tax Paid | Tax Assessment Tax Assessment Total Assessment is a certain percentage of the fair market value that is determined by local assessors to be the total taxable value of land and additions on the property. | Land | Improvement |
|---|---|---|---|---|
| 2025 | $3,159 | $111,760 | $12,000 | $99,760 |
| 2024 | $3,159 | $109,200 | $12,000 | $97,200 |
| 2023 | $2,661 | $108,360 | $10,000 | $98,360 |
| 2022 | $2,603 | $83,640 | $10,000 | $73,640 |
| 2021 | $1,874 | $68,640 | $10,000 | $58,640 |
| 2020 | $1,772 | $64,320 | $10,000 | $54,320 |
| 2019 | $1,580 | $55,600 | $8,000 | $47,600 |
| 2018 | $1,493 | $52,160 | $8,000 | $44,160 |
| 2016 | $1,350 | $46,200 | $6,000 | $40,200 |
| 2015 | $1,473 | $39,000 | $6,000 | $33,000 |
| 2014 | $1,158 | $30,440 | $4,000 | $26,440 |
Source: Public Records
Map
Nearby Homes
- 14803 Woolsey Rd
- 2 Cindy Ct
- 108 Nicki Ct
- 218 Nicki Ct
- 130 Nicki Ct
- 113 Canal St
- 337 Amsterdam Way
- 640 Edgar St
- 400 Beachview Rd
- 110 Canal St
- 133 Canal St
- 244 Wallingford Dr
- 25 Georgia Ave
- 150 Oxford Cir
- 192 Oxford Cir
- 541 Hamlet Dr
- 2 AC Highway 20
- 55 Porter Cir
- 10 Plum Blossom Ln
- 302 Friendship Oak Way
Your Personal Tour Guide
Ask me questions while you tour the home.