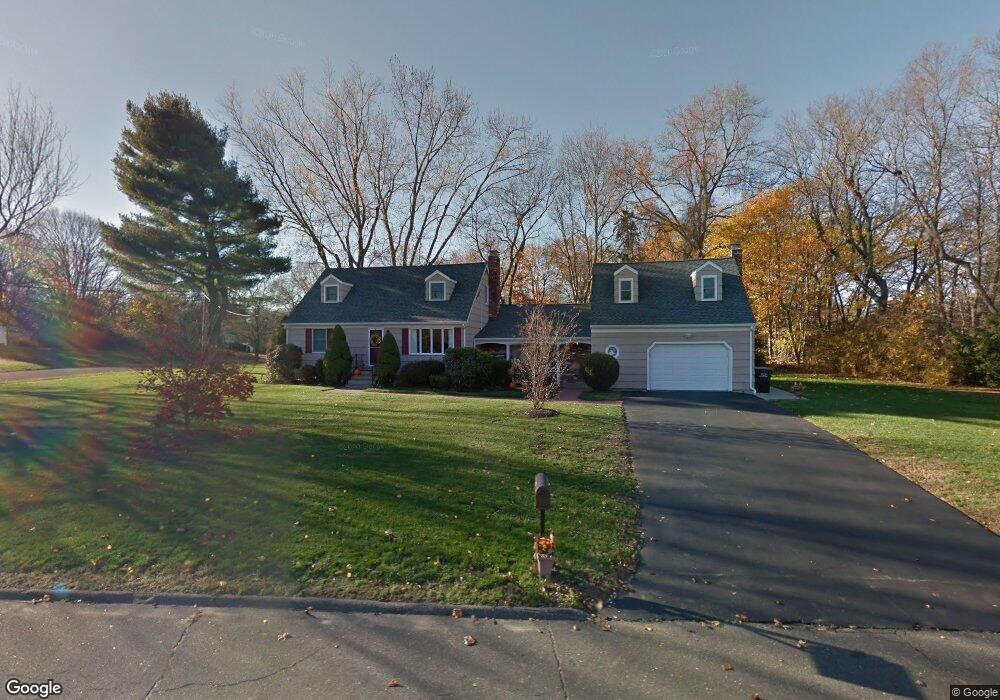
5 Linley Rd Trumbull, CT 06611
Trumbull Center NeighborhoodEstimated Value: $633,000 - $756,000
4
Beds
3
Baths
2,198
Sq Ft
$310/Sq Ft
Est. Value
About This Home
This home is located at 5 Linley Rd, Trumbull, CT 06611 and is currently estimated at $680,890, approximately $309 per square foot. 5 Linley Rd is a home located in Fairfield County with nearby schools including Middlebrook School, Madison Middle School, and Trumbull High School.
Ownership History
Date
Name
Owned For
Owner Type
Purchase Details
Closed on
Jun 21, 2001
Sold by
Haynes Bruce D and Solovitch Syma
Bought by
Agostin Jeffrey and Agostin Maryann
Current Estimated Value
Purchase Details
Closed on
Jun 25, 1997
Sold by
Ferri Maria
Bought by
Haynes Bruce D and Solovitch Syma L
Purchase Details
Closed on
Jun 9, 1987
Sold by
Pernaveau Amelia
Bought by
Ferri Anthony
Create a Home Valuation Report for This Property
The Home Valuation Report is an in-depth analysis detailing your home's value as well as a comparison with similar homes in the area
Home Values in the Area
Average Home Value in this Area
Purchase History
| Date | Buyer | Sale Price | Title Company |
|---|---|---|---|
| Agostin Jeffrey | $320,000 | -- | |
| Haynes Bruce D | $123,500 | -- | |
| Haynes Bruce D | $123,500 | -- | |
| Ferri Anthony | $265,000 | -- |
Source: Public Records
Mortgage History
| Date | Status | Borrower | Loan Amount |
|---|---|---|---|
| Open | Ferri Anthony | $100,000 | |
| Open | Ferri Anthony | $213,250 |
Source: Public Records
Tax History
| Year | Tax Paid | Tax Assessment Tax Assessment Total Assessment is a certain percentage of the fair market value that is determined by local assessors to be the total taxable value of land and additions on the property. | Land | Improvement |
|---|---|---|---|---|
| 2025 | $11,312 | $306,390 | $150,780 | $155,610 |
| 2024 | $11,002 | $306,390 | $150,780 | $155,610 |
| 2023 | $10,825 | $306,390 | $150,780 | $155,610 |
| 2022 | $10,652 | $306,390 | $150,780 | $155,610 |
| 2021 | $9,204 | $251,860 | $125,650 | $126,210 |
| 2020 | $9,029 | $251,860 | $125,650 | $126,210 |
| 2018 | $8,806 | $251,860 | $125,650 | $126,210 |
| 2017 | $8,629 | $251,860 | $125,650 | $126,210 |
| 2016 | $8,455 | $251,860 | $125,650 | $126,210 |
| 2015 | $8,613 | $253,600 | $125,700 | $127,900 |
| 2014 | $8,427 | $253,600 | $125,700 | $127,900 |
Source: Public Records
Map
Nearby Homes
- 30 Windy Ridge
- 546 Church Hill Rd
- Lot 31 Valley View Rd
- 58 Daniels Farm Rd
- 877 White Plains Rd
- 26 Grove St
- 253 Mayfield Dr Unit 253
- 177 Mayfield Dr
- 25 Plymouth Ave
- 215 Fernwood Rd
- 71 Cider Mill Ln
- 45 Frenchtown Rd
- 40 Rose Terrace
- 65 Bonnie View Dr
- 15 Glenarden Rd
- 1403 Old Town Rd Unit 1403
- 11 Linda Dr
- 74 Village Ln
- 15 Squire Ct
- 563 Lakeside Dr
Your Personal Tour Guide
Ask me questions while you tour the home.