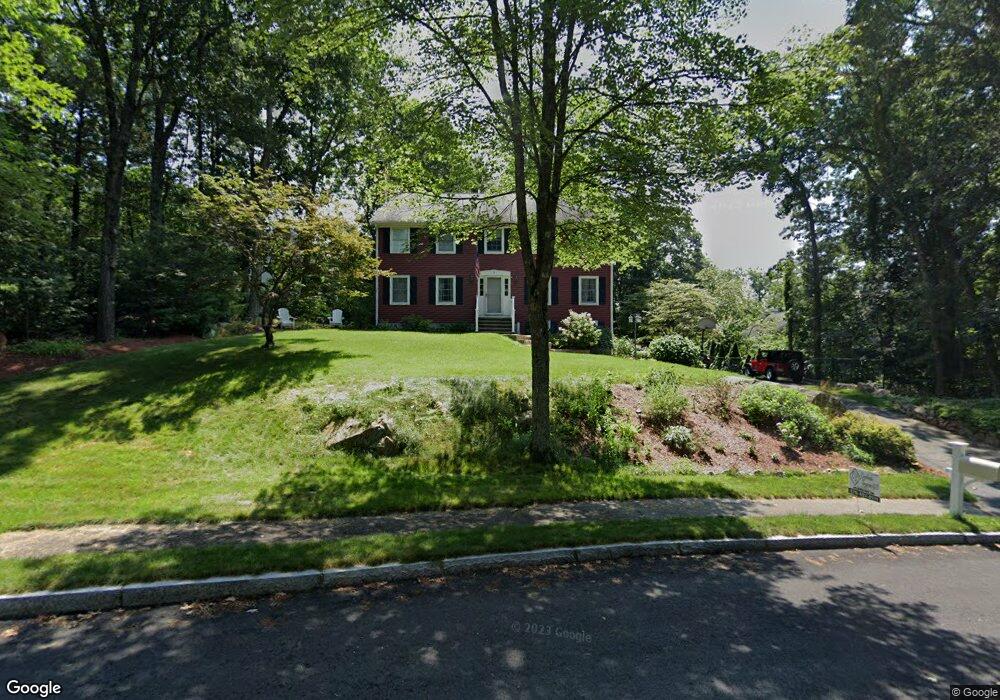
5 Lorin Dr Wilmington, MA 01887
Estimated Value: $956,000 - $1,149,000
4
Beds
3
Baths
2,240
Sq Ft
$457/Sq Ft
Est. Value
About This Home
This home is located at 5 Lorin Dr, Wilmington, MA 01887 and is currently estimated at $1,023,581, approximately $456 per square foot. 5 Lorin Dr is a home located in Middlesex County with nearby schools including Wilmington Middle School, Wilmington High School, and Abundant Life Christian School and Childcare.
Ownership History
Date
Name
Owned For
Owner Type
Purchase Details
Closed on
Mar 27, 2009
Sold by
Homesales Inc
Bought by
Hanson Jeremy E
Current Estimated Value
Home Financials for this Owner
Home Financials are based on the most recent Mortgage that was taken out on this home.
Original Mortgage
$380,480
Interest Rate
5.14%
Mortgage Type
Purchase Money Mortgage
Purchase Details
Closed on
Mar 5, 2009
Sold by
Kane Brian M
Bought by
Homesales Inc
Home Financials for this Owner
Home Financials are based on the most recent Mortgage that was taken out on this home.
Original Mortgage
$380,480
Interest Rate
5.14%
Mortgage Type
Purchase Money Mortgage
Purchase Details
Closed on
Jun 14, 2002
Sold by
Collier-Rogers Kelley and Rogers Joseph W
Bought by
Kane Brian M
Purchase Details
Closed on
Jul 13, 1987
Sold by
Lorin Corp
Bought by
Collier Allen A
Create a Home Valuation Report for This Property
The Home Valuation Report is an in-depth analysis detailing your home's value as well as a comparison with similar homes in the area
Home Values in the Area
Average Home Value in this Area
Purchase History
| Date | Buyer | Sale Price | Title Company |
|---|---|---|---|
| Hanson Jeremy E | $387,500 | -- | |
| Homesales Inc | $443,586 | -- | |
| Kane Brian M | $429,400 | -- | |
| Collier Allen A | $249,900 | -- |
Source: Public Records
Mortgage History
| Date | Status | Borrower | Loan Amount |
|---|---|---|---|
| Open | Collier Allen A | $377,000 | |
| Closed | Collier Allen A | $376,000 | |
| Closed | Hanson Jeremy E | $380,480 |
Source: Public Records
Tax History Compared to Growth
Tax History
| Year | Tax Paid | Tax Assessment Tax Assessment Total Assessment is a certain percentage of the fair market value that is determined by local assessors to be the total taxable value of land and additions on the property. | Land | Improvement |
|---|---|---|---|---|
| 2025 | $10,489 | $916,100 | $361,400 | $554,700 |
| 2024 | $10,279 | $899,300 | $361,400 | $537,900 |
| 2023 | $9,338 | $782,100 | $306,500 | $475,600 |
| 2022 | $8,806 | $675,800 | $255,400 | $420,400 |
| 2021 | $8,693 | $628,100 | $232,200 | $395,900 |
| 2020 | $8,349 | $614,800 | $232,200 | $382,600 |
| 2019 | $8,236 | $599,000 | $227,100 | $371,900 |
| 2018 | $7,917 | $549,400 | $216,300 | $333,100 |
| 2017 | $7,696 | $532,600 | $216,300 | $316,300 |
| 2016 | $7,216 | $493,200 | $206,000 | $287,200 |
| 2015 | $6,949 | $483,600 | $206,000 | $277,600 |
| 2014 | $6,509 | $457,100 | $196,100 | $261,000 |
Source: Public Records
Map
Nearby Homes