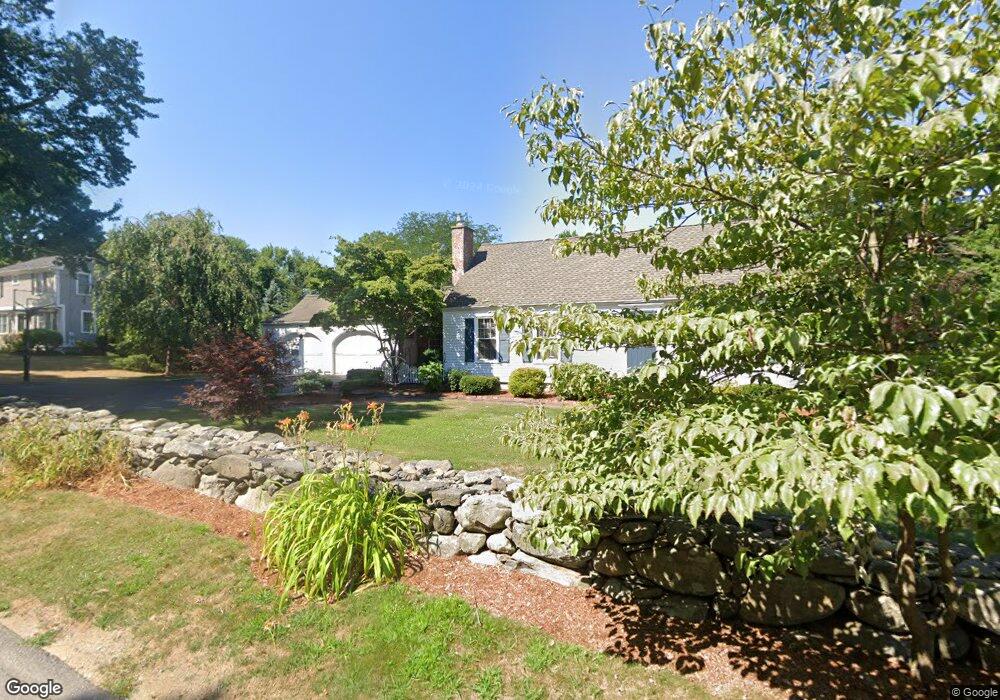
5 Lyons St Westborough, MA 01581
Estimated Value: $700,540 - $837,000
4
Beds
2
Baths
1,982
Sq Ft
$380/Sq Ft
Est. Value
About This Home
This home is located at 5 Lyons St, Westborough, MA 01581 and is currently estimated at $752,385, approximately $379 per square foot. 5 Lyons St is a home located in Worcester County with nearby schools including Westborough High School, Westboro Knowledge Beginnings, and Ebridge Montessori School.
Ownership History
Date
Name
Owned For
Owner Type
Purchase Details
Closed on
Jan 21, 1999
Sold by
Ritacco Francis P and Ritacco Joyce F
Bought by
Ritacco Kenneth J and Ritacco Suzanne
Current Estimated Value
Home Financials for this Owner
Home Financials are based on the most recent Mortgage that was taken out on this home.
Original Mortgage
$175,000
Interest Rate
6.7%
Mortgage Type
Purchase Money Mortgage
Create a Home Valuation Report for This Property
The Home Valuation Report is an in-depth analysis detailing your home's value as well as a comparison with similar homes in the area
Home Values in the Area
Average Home Value in this Area
Purchase History
| Date | Buyer | Sale Price | Title Company |
|---|---|---|---|
| Ritacco Kenneth J | $245,000 | -- |
Source: Public Records
Mortgage History
| Date | Status | Borrower | Loan Amount |
|---|---|---|---|
| Open | Ritacco Kenneth J | $150,000 | |
| Closed | Ritacco Kenneth J | $50,000 | |
| Closed | Ritacco Kenneth J | $175,000 | |
| Previous Owner | Ritacco Kenneth J | $60,000 |
Source: Public Records
Tax History
| Year | Tax Paid | Tax Assessment Tax Assessment Total Assessment is a certain percentage of the fair market value that is determined by local assessors to be the total taxable value of land and additions on the property. | Land | Improvement |
|---|---|---|---|---|
| 2025 | $10,559 | $648,200 | $336,500 | $311,700 |
| 2024 | $9,826 | $598,800 | $299,200 | $299,600 |
| 2023 | $9,151 | $543,400 | $282,300 | $261,100 |
| 2022 | $8,873 | $479,900 | $238,700 | $241,200 |
| 2021 | $3,854 | $469,400 | $228,200 | $241,200 |
| 2020 | $9,981 | $450,800 | $209,600 | $241,200 |
| 2019 | $3,283 | $440,800 | $211,600 | $229,200 |
| 2018 | $10,350 | $406,300 | $203,300 | $203,000 |
| 2017 | $2,654 | $406,300 | $203,300 | $203,000 |
| 2016 | $6,731 | $378,800 | $186,700 | $192,100 |
| 2015 | $6,213 | $334,200 | $166,000 | $168,200 |
Source: Public Records
Map
Nearby Homes
- 17 Walker St
- 8 Rock Spring Ln
- 2306 Talbot Way Unit 2306
- 2 Talbot Way Unit 2103
- 2 Talbot Way Unit 2208
- 11101 Peters Farm Way Unit 101
- 1109 Peters Farm Way Unit 1109
- 1102 Peters Farm Way Unit 1102
- 5 Peters Farm Way Unit 209
- 5 Peters Farm Way Unit 111
- 5 Peters Farm Way Unit 206
- 5 Peters Farm Way Unit 107
- 5 Peters Farm Way Unit 103
- 5 Peters Farm Way Unit 406
- 5 Peters Farm Way Unit 201
- 5 Peters Farm Way Unit 5205
- 5 Peters Farm Way Unit 113
- 5 Peters Farm Way Unit 401
- 5 Peters Farm Way Unit 213
- 2 Codman Way Unit 402
Your Personal Tour Guide
Ask me questions while you tour the home.