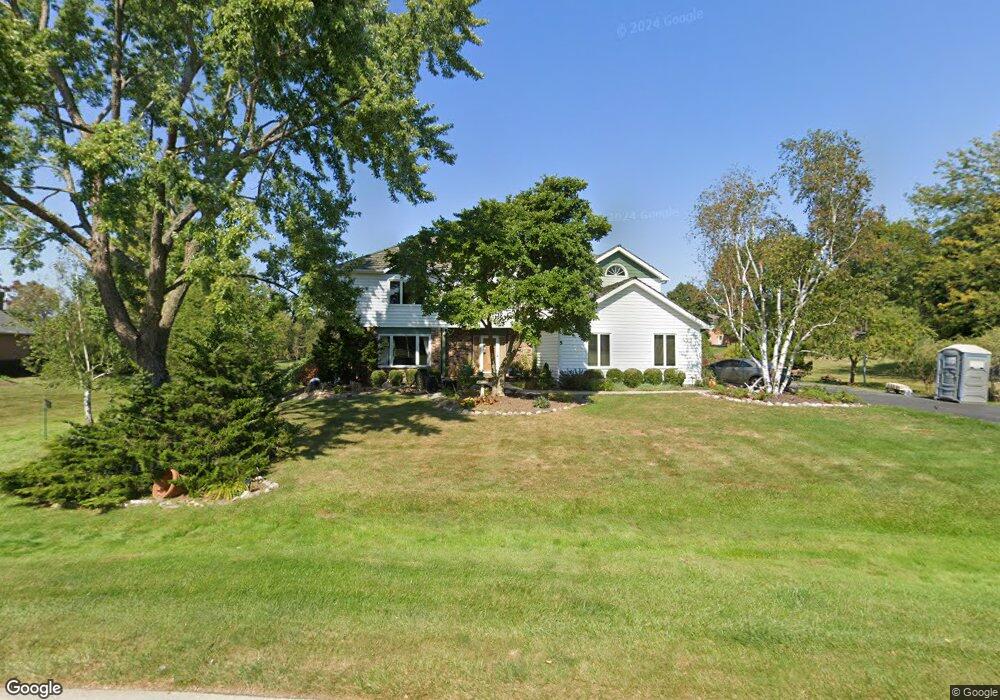
5 Magnolia Pkwy Hawthorn Woods, IL 60047
Estimated Value: $722,479 - $910,000
4
Beds
3
Baths
2,996
Sq Ft
$266/Sq Ft
Est. Value
About This Home
This home is located at 5 Magnolia Pkwy, Hawthorn Woods, IL 60047 and is currently estimated at $796,870, approximately $265 per square foot. 5 Magnolia Pkwy is a home located in Lake County with nearby schools including Fremont Elementary School, Fremont Intermediate School, and Fremont Jr High/Middle School.
Ownership History
Date
Name
Owned For
Owner Type
Purchase Details
Closed on
May 10, 2005
Sold by
Mcauliffe Patrick and Mcauliffe Carol
Bought by
Loos Igor and Loos Irene
Current Estimated Value
Home Financials for this Owner
Home Financials are based on the most recent Mortgage that was taken out on this home.
Original Mortgage
$448,000
Interest Rate
5.75%
Mortgage Type
Fannie Mae Freddie Mac
Purchase Details
Closed on
Aug 5, 1996
Sold by
Park Patricia L and The Patricia L Park Living Tru
Bought by
Mcauliffe Patrick and Mcauliffe Carol
Home Financials for this Owner
Home Financials are based on the most recent Mortgage that was taken out on this home.
Original Mortgage
$300,500
Interest Rate
7.75%
Purchase Details
Closed on
Jul 19, 1994
Sold by
Park Patricia L
Bought by
Park Patricia L and Patricia L Park Living Trust
Create a Home Valuation Report for This Property
The Home Valuation Report is an in-depth analysis detailing your home's value as well as a comparison with similar homes in the area
Home Values in the Area
Average Home Value in this Area
Purchase History
| Date | Buyer | Sale Price | Title Company |
|---|---|---|---|
| Loos Igor | $560,000 | -- | |
| Mcauliffe Patrick | $334,000 | -- | |
| Park Patricia L | -- | -- |
Source: Public Records
Mortgage History
| Date | Status | Borrower | Loan Amount |
|---|---|---|---|
| Previous Owner | Loos Igor | $448,000 | |
| Previous Owner | Mcauliffe Patrick | $300,500 |
Source: Public Records
Tax History Compared to Growth
Tax History
| Year | Tax Paid | Tax Assessment Tax Assessment Total Assessment is a certain percentage of the fair market value that is determined by local assessors to be the total taxable value of land and additions on the property. | Land | Improvement |
|---|---|---|---|---|
| 2024 | $14,161 | $168,631 | $35,653 | $132,978 |
| 2023 | $13,648 | $164,101 | $34,695 | $129,406 |
| 2022 | $13,648 | $156,418 | $34,988 | $121,430 |
| 2021 | $13,168 | $152,409 | $34,091 | $118,318 |
| 2020 | $13,279 | $152,409 | $34,091 | $118,318 |
| 2019 | $13,359 | $154,882 | $33,794 | $121,088 |
| 2018 | $13,342 | $156,916 | $36,352 | $120,564 |
| 2017 | $13,308 | $155,025 | $35,914 | $119,111 |
| 2016 | $13,069 | $150,116 | $34,777 | $115,339 |
| 2015 | $13,111 | $142,981 | $33,124 | $109,857 |
| 2014 | $13,052 | $141,692 | $39,100 | $102,592 |
| 2012 | $12,439 | $141,990 | $39,182 | $102,808 |
Source: Public Records
Map
Nearby Homes
- 24150 Gilmer Rd
- 4904 Clover Ct
- 20110 W Old Meadow Trail
- 23520 N Old Mchenry Rd
- 4595 Patricia Dr
- 4597 Patricia Dr
- 4594 Patricia Dr
- 6764 W Creekside Dr
- 4570 Pamela Ct
- 3 Jane Ct
- 19925 Indian Creek Rd
- 4610 Forest Way Cir Unit 4
- 4612 Forest Way Cir
- 4613 Forest Way Cir
- 4542 Kimberly Ct
- 21019 W Preserve Dr
- 6235 Pine Tree Dr
- 4764 Wellington Dr
- 21 Hawthorn Dr
- 20979 W Preserve Dr