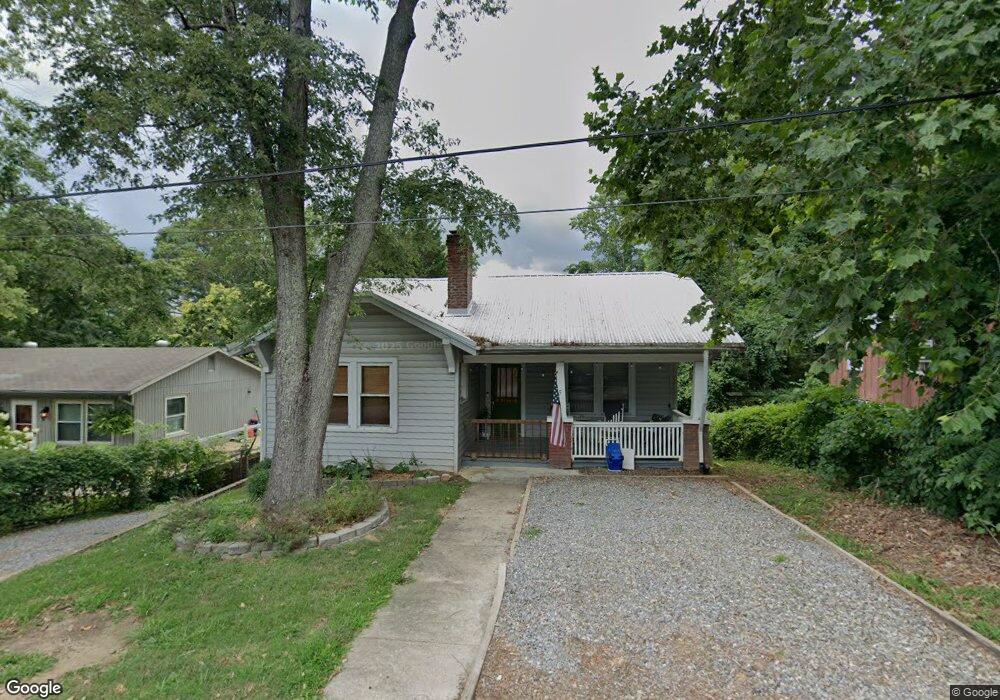
5 Main St Unit 9 Asheville, NC 28803
Oakley NeighborhoodEstimated Value: $379,000 - $528,000
3
Beds
2
Baths
1,280
Sq Ft
$333/Sq Ft
Est. Value
About This Home
This home is located at 5 Main St Unit 9, Asheville, NC 28803 and is currently estimated at $426,389, approximately $333 per square foot. 5 Main St Unit 9 is a home located in Buncombe County with nearby schools including A.C. Reynolds High School, Oakley Elementary, and A.C. Reynolds Middle School.
Ownership History
Date
Name
Owned For
Owner Type
Purchase Details
Closed on
Oct 12, 2021
Sold by
Steingress Fredrick M and Wondergem Catherine E
Bought by
Stratton Amanda N and Stratton Michael D
Current Estimated Value
Home Financials for this Owner
Home Financials are based on the most recent Mortgage that was taken out on this home.
Original Mortgage
$237,440
Outstanding Balance
$216,523
Interest Rate
2.8%
Mortgage Type
New Conventional
Estimated Equity
$209,866
Purchase Details
Closed on
Oct 20, 2015
Bought by
Steingress Fredrick and Wondergem Catherine
Purchase Details
Closed on
Mar 13, 1998
Sold by
Steingress Susan W
Bought by
Steingress Frederick M
Create a Home Valuation Report for This Property
The Home Valuation Report is an in-depth analysis detailing your home's value as well as a comparison with similar homes in the area
Home Values in the Area
Average Home Value in this Area
Purchase History
| Date | Buyer | Sale Price | Title Company |
|---|---|---|---|
| Stratton Amanda N | $297,000 | None Available | |
| Steingress Fredrick | -- | -- | |
| Steingress Frederick M | -- | -- |
Source: Public Records
Mortgage History
| Date | Status | Borrower | Loan Amount |
|---|---|---|---|
| Open | Stratton Amanda N | $237,440 |
Source: Public Records
Tax History Compared to Growth
Tax History
| Year | Tax Paid | Tax Assessment Tax Assessment Total Assessment is a certain percentage of the fair market value that is determined by local assessors to be the total taxable value of land and additions on the property. | Land | Improvement |
|---|---|---|---|---|
| 2025 | $2,796 | $278,500 | $70,400 | $208,100 |
| 2024 | $2,796 | $301,700 | $70,400 | $231,300 |
| 2023 | $2,796 | $296,200 | $70,400 | $225,800 |
| 2022 | $2,209 | $247,900 | $70,400 | $177,500 |
| 2021 | $1,721 | $193,100 | $0 | $0 |
| 2020 | $1,415 | $147,700 | $0 | $0 |
| 2019 | $1,415 | $147,700 | $0 | $0 |
| 2018 | $1,415 | $147,700 | $0 | $0 |
| 2017 | $1,430 | $112,000 | $0 | $0 |
| 2016 | $1,208 | $112,000 | $0 | $0 |
| 2015 | $1,208 | $112,000 | $0 | $0 |
| 2014 | $1,192 | $112,000 | $0 | $0 |
Source: Public Records
Map
Nearby Homes