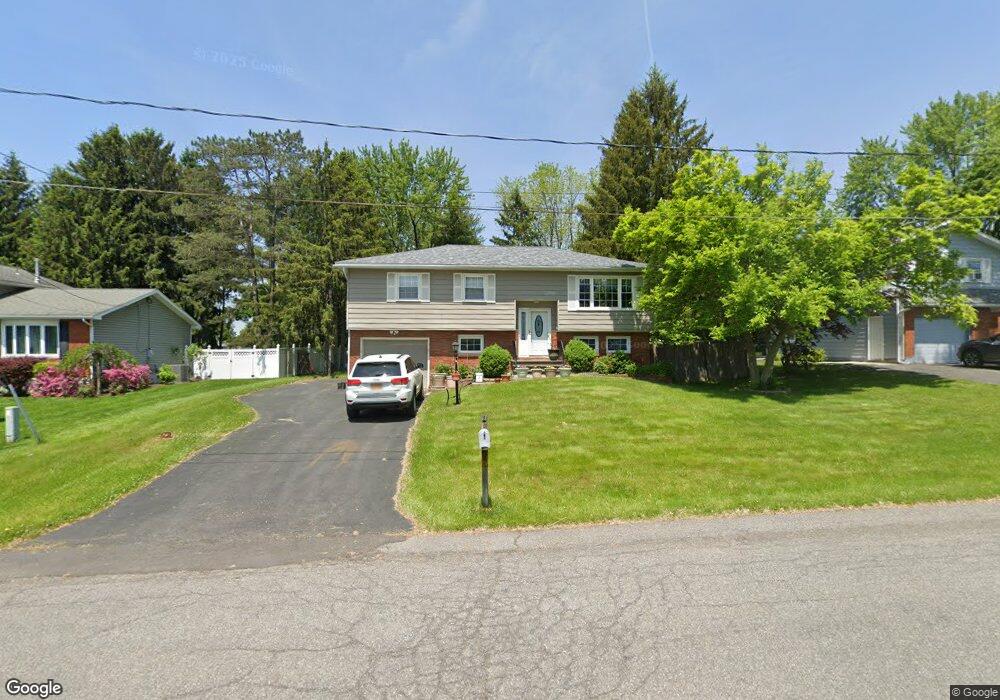
5 Mallard Ln Latham, NY 12110
Estimated Value: $380,000 - $413,000
3
Beds
2
Baths
1,764
Sq Ft
$224/Sq Ft
Est. Value
About This Home
This home is located at 5 Mallard Ln, Latham, NY 12110 and is currently estimated at $394,818, approximately $223 per square foot. 5 Mallard Ln is a home located in Albany County with nearby schools including Forts Ferry School, Shaker Junior High School, and Shaker High School.
Ownership History
Date
Name
Owned For
Owner Type
Purchase Details
Closed on
Apr 10, 2007
Sold by
Pruyn John
Bought by
Dang Vy T
Current Estimated Value
Home Financials for this Owner
Home Financials are based on the most recent Mortgage that was taken out on this home.
Original Mortgage
$176,250
Outstanding Balance
$107,092
Interest Rate
6.24%
Estimated Equity
$287,726
Purchase Details
Closed on
Oct 31, 2002
Sold by
Demayo Vincent F
Bought by
Pruyn John
Create a Home Valuation Report for This Property
The Home Valuation Report is an in-depth analysis detailing your home's value as well as a comparison with similar homes in the area
Home Values in the Area
Average Home Value in this Area
Purchase History
| Date | Buyer | Sale Price | Title Company |
|---|---|---|---|
| Dang Vy T | $235,000 | Briar Rohan | |
| Dang Vy T | $235,000 | Stewart Title Insurance Comp | |
| Pruyn John | $155,000 | E M Jr Sneeringer |
Source: Public Records
Mortgage History
| Date | Status | Borrower | Loan Amount |
|---|---|---|---|
| Open | Dang Vy T | $176,250 |
Source: Public Records
Tax History Compared to Growth
Tax History
| Year | Tax Paid | Tax Assessment Tax Assessment Total Assessment is a certain percentage of the fair market value that is determined by local assessors to be the total taxable value of land and additions on the property. | Land | Improvement |
|---|---|---|---|---|
| 2024 | $4,967 | $120,000 | $30,000 | $90,000 |
| 2023 | $4,845 | $120,000 | $30,000 | $90,000 |
| 2022 | $4,939 | $120,000 | $30,000 | $90,000 |
| 2021 | $4,918 | $120,000 | $30,000 | $90,000 |
| 2020 | $4,338 | $120,000 | $30,000 | $90,000 |
| 2019 | $2,435 | $120,000 | $30,000 | $90,000 |
| 2018 | $4,248 | $120,000 | $30,000 | $90,000 |
| 2017 | $0 | $120,000 | $30,000 | $90,000 |
| 2016 | $4,106 | $120,000 | $30,000 | $90,000 |
| 2015 | -- | $120,000 | $30,000 | $90,000 |
| 2014 | -- | $120,000 | $30,000 | $90,000 |
Source: Public Records
Map
Nearby Homes