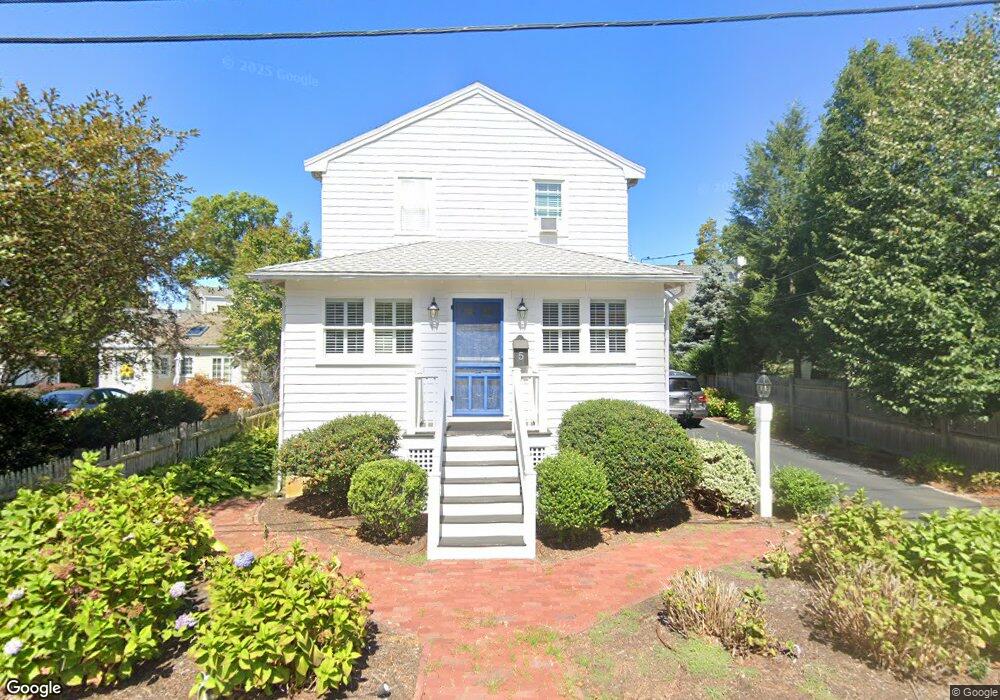
5 Maple St Hingham, MA 02043
Estimated Value: $1,182,000 - $1,426,000
3
Beds
2
Baths
1,562
Sq Ft
$810/Sq Ft
Est. Value
About This Home
This home is located at 5 Maple St, Hingham, MA 02043 and is currently estimated at $1,264,818, approximately $809 per square foot. 5 Maple St is a home located in Plymouth County with nearby schools including William L. Foster Elementary School, Hingham Middle School, and Hingham High School.
Ownership History
Date
Name
Owned For
Owner Type
Purchase Details
Closed on
Apr 13, 2018
Sold by
Armstrong Aimee
Bought by
Donovan Kevin P and Donovan Aimee
Current Estimated Value
Home Financials for this Owner
Home Financials are based on the most recent Mortgage that was taken out on this home.
Original Mortgage
$219,000
Outstanding Balance
$186,662
Interest Rate
4.43%
Mortgage Type
New Conventional
Estimated Equity
$1,078,156
Purchase Details
Closed on
Dec 7, 2012
Sold by
Hedlund Heather
Bought by
Donovan Kevin P and Kafka Aimee
Home Financials for this Owner
Home Financials are based on the most recent Mortgage that was taken out on this home.
Original Mortgage
$226,902
Interest Rate
3.25%
Mortgage Type
FHA
Purchase Details
Closed on
Jun 1, 2001
Sold by
Johnson Marshall E and Vandini Charlene
Bought by
Hedlund Heather
Create a Home Valuation Report for This Property
The Home Valuation Report is an in-depth analysis detailing your home's value as well as a comparison with similar homes in the area
Purchase History
| Date | Buyer | Sale Price | Title Company |
|---|---|---|---|
| Donovan Kevin P | -- | -- | |
| Donovan Kevin P | $503,000 | -- | |
| Hedlund Heather | $340,000 | -- | |
| Donovan Kevin P | -- | -- | |
| Hedlund Heather | $340,000 | -- |
Source: Public Records
Mortgage History
| Date | Status | Borrower | Loan Amount |
|---|---|---|---|
| Open | Donovan Kevin P | $219,000 | |
| Closed | Hedlund Heather | $219,000 | |
| Previous Owner | Donovan Kevin P | $226,902 |
Source: Public Records
Tax History
| Year | Tax Paid | Tax Assessment Tax Assessment Total Assessment is a certain percentage of the fair market value that is determined by local assessors to be the total taxable value of land and additions on the property. | Land | Improvement |
|---|---|---|---|---|
| 2025 | $7,232 | $676,500 | $387,200 | $289,300 |
| 2024 | $7,073 | $651,900 | $387,200 | $264,700 |
| 2023 | $6,286 | $628,600 | $387,200 | $241,400 |
| 2022 | $6,000 | $519,000 | $322,700 | $196,300 |
| 2021 | $6,469 | $507,800 | $322,700 | $185,100 |
| 2020 | $5,855 | $507,800 | $322,700 | $185,100 |
| 2019 | $5,864 | $496,500 | $322,700 | $173,800 |
| 2018 | $5,802 | $496,500 | $322,700 | $173,800 |
| 2017 | $6,339 | $446,400 | $295,100 | $151,300 |
| 2016 | $5,201 | $416,400 | $238,900 | $177,500 |
| 2015 | $5,152 | $411,200 | $227,500 | $183,700 |
Source: Public Records
Map
Nearby Homes
Your Personal Tour Guide
Ask me questions while you tour the home.