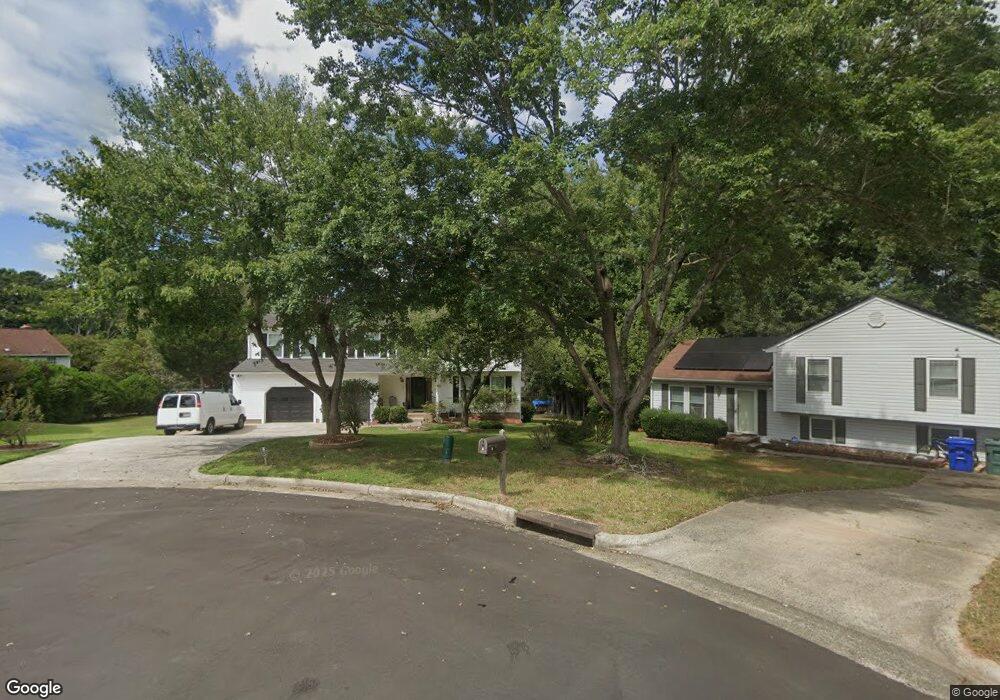
5 Mars Ct Durham, NC 27703
Eastern Durham NeighborhoodEstimated Value: $356,000 - $435,691
3
Beds
3
Baths
2,616
Sq Ft
$154/Sq Ft
Est. Value
About This Home
This home is located at 5 Mars Ct, Durham, NC 27703 and is currently estimated at $403,173, approximately $154 per square foot. 5 Mars Ct is a home located in Durham County with nearby schools including Merrick-Moore Elementary School, John W Neal Middle School, and Southern School of Energy & Sustainability.
Ownership History
Date
Name
Owned For
Owner Type
Purchase Details
Closed on
Jun 23, 1999
Sold by
Lawrence Barney E and Lawrence Brenda R
Bought by
Thomas Nancy Deadwyler
Current Estimated Value
Home Financials for this Owner
Home Financials are based on the most recent Mortgage that was taken out on this home.
Original Mortgage
$141,923
Outstanding Balance
$37,677
Interest Rate
7.13%
Mortgage Type
FHA
Estimated Equity
$365,496
Purchase Details
Closed on
Mar 31, 1999
Sold by
D R Horton Inc Torrey
Bought by
Keohane Michael D and Keohane Laurie A
Home Financials for this Owner
Home Financials are based on the most recent Mortgage that was taken out on this home.
Original Mortgage
$144,998
Interest Rate
6.82%
Mortgage Type
VA
Create a Home Valuation Report for This Property
The Home Valuation Report is an in-depth analysis detailing your home's value as well as a comparison with similar homes in the area
Home Values in the Area
Average Home Value in this Area
Purchase History
| Date | Buyer | Sale Price | Title Company |
|---|---|---|---|
| Thomas Nancy Deadwyler | $142,000 | -- | |
| Keohane Michael D | $141,000 | -- |
Source: Public Records
Mortgage History
| Date | Status | Borrower | Loan Amount |
|---|---|---|---|
| Open | Thomas Nancy Deadwyler | $141,923 | |
| Previous Owner | Keohane Michael D | $144,998 |
Source: Public Records
Tax History
| Year | Tax Paid | Tax Assessment Tax Assessment Total Assessment is a certain percentage of the fair market value that is determined by local assessors to be the total taxable value of land and additions on the property. | Land | Improvement |
|---|---|---|---|---|
| 2025 | $2,427 | $408,008 | $89,050 | $318,958 |
| 2024 | $2,072 | $247,585 | $27,460 | $220,125 |
| 2023 | $3,243 | $247,585 | $27,460 | $220,125 |
| 2022 | $3,169 | $247,585 | $27,460 | $220,125 |
| 2021 | $3,154 | $247,585 | $27,460 | $220,125 |
| 2020 | $3,080 | $247,585 | $27,460 | $220,125 |
| 2019 | $3,080 | $247,585 | $27,460 | $220,125 |
| 2018 | $2,701 | $199,148 | $27,460 | $171,688 |
| 2017 | $2,682 | $199,148 | $27,460 | $171,688 |
| 2016 | $2,591 | $199,148 | $27,460 | $171,688 |
| 2015 | $2,907 | $210,032 | $28,842 | $181,190 |
| 2014 | $2,907 | $210,032 | $28,842 | $181,190 |
Source: Public Records
Map
Nearby Homes
- 7 Mercury Ct
- 3201 Venus Dr
- 1002 Alpha Dr
- 709 Grandview Dr
- 0 Seford Dr
- 2028 Seford Dr
- 217 Fountain St
- 703 Chopper Ln Unit 12
- 209 Fountain St
- 10 Bentwood Place
- 912 Obsidian Way
- 620 Hurley Rd
- 3511 Thornwood Dr
- 1007 Shovelhead Dr
- 916 Clayton Rd
- 412 Maymont Dr
- 403 Chadbourne Dr
- 3602 Thornwood Dr
- 1011 Homecoming Way
- 3033 Fenimore St
Your Personal Tour Guide
Ask me questions while you tour the home.