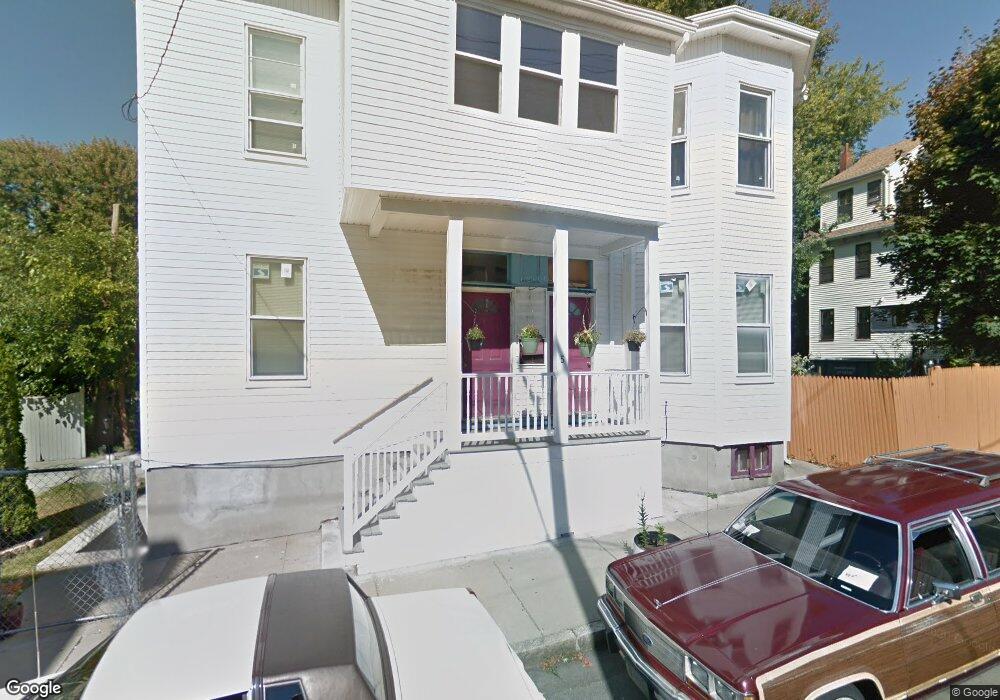
5 Maybury St Dorchester, MA 02121
Sav-Mor NeighborhoodEstimated Value: $479,704 - $1,264,000
6
Beds
4
Baths
3,245
Sq Ft
$239/Sq Ft
Est. Value
About This Home
This home is located at 5 Maybury St, Dorchester, MA 02121 and is currently estimated at $774,926, approximately $238 per square foot. 5 Maybury St is a home located in Suffolk County with nearby schools including Bridge Boston Charter School and Uncommon Schools Roxbury Prep Dorchester Campus.
Ownership History
Date
Name
Owned For
Owner Type
Purchase Details
Closed on
Jul 16, 2021
Sold by
Pina Sonia
Bought by
Sonia Pina Ret
Current Estimated Value
Purchase Details
Closed on
Mar 29, 2010
Sold by
Searight Meeckral and Johnson-King Joyce M
Bought by
Pina Sonia
Home Financials for this Owner
Home Financials are based on the most recent Mortgage that was taken out on this home.
Original Mortgage
$188,143
Interest Rate
5.02%
Mortgage Type
Purchase Money Mortgage
Create a Home Valuation Report for This Property
The Home Valuation Report is an in-depth analysis detailing your home's value as well as a comparison with similar homes in the area
Home Values in the Area
Average Home Value in this Area
Purchase History
| Date | Buyer | Sale Price | Title Company |
|---|---|---|---|
| Sonia Pina Ret | -- | None Available | |
| Pina Sonia | $210,000 | -- |
Source: Public Records
Mortgage History
| Date | Status | Borrower | Loan Amount |
|---|---|---|---|
| Previous Owner | Pina Sonia | $188,143 |
Source: Public Records
Tax History Compared to Growth
Tax History
| Year | Tax Paid | Tax Assessment Tax Assessment Total Assessment is a certain percentage of the fair market value that is determined by local assessors to be the total taxable value of land and additions on the property. | Land | Improvement |
|---|---|---|---|---|
| 2025 | $5,819 | $502,500 | $181,300 | $321,200 |
| 2024 | $5,198 | $476,900 | $204,600 | $272,300 |
| 2023 | $4,879 | $454,300 | $194,900 | $259,400 |
| 2022 | $4,705 | $432,400 | $185,500 | $246,900 |
| 2021 | $4,395 | $411,900 | $176,700 | $235,200 |
| 2020 | $4,053 | $383,800 | $164,700 | $219,100 |
| 2019 | $3,612 | $342,700 | $118,400 | $224,300 |
| 2018 | $3,325 | $317,300 | $118,400 | $198,900 |
| 2017 | $3,360 | $317,300 | $118,400 | $198,900 |
| 2016 | $3,035 | $275,900 | $118,400 | $157,500 |
| 2015 | $3,152 | $260,300 | $100,900 | $159,400 |
| 2014 | $3,059 | $243,200 | $100,900 | $142,300 |
Source: Public Records
Map
Nearby Homes
- 476 Warren St
- 472 Warren St
- 36-38 Elm Hill Park
- 2 Otisfield St
- 495 Warren St
- 4 Wyoming St Unit 2
- 7 Waumbeck St Unit 3
- 16 Wabon St
- 28 Wabon St
- 52 Intervale St
- 40 Devon St Unit 3
- 31 Dewey St
- 194 Blue Hill Ave
- 175 Howard Ave Unit 2
- 8 Adrian St
- 63 Normandy St
- 28 Woodbine St
- 164 Ruthven St Unit 1
- 99 Harrishof St
- 96-98 Woodledge St
- 18 Holborn St Unit 1
- 13 Weldon St
- 3 Weldon St Unit 1
- 22 Holborn St
- 57 Weldon St
- 5-7 Weldon St
- 24 Weldon St
- 16 Holborn St
- 4 Maybury St
- 24 Holborn St Unit 3B
- 24-26 Holborn St Unit 3A
- 24 Holborn St Unit 26
- 24 Holborn St Unit 26
- 24 Holborn St Unit 26
- 24 Holborn St Unit 26
- 24 Holborn St Unit 26
- 24 Holborn St Unit 26
- 24-26 Holborn St Unit 2A
- 24 Holborn St
- 24-26 Holborn St Unit 1A