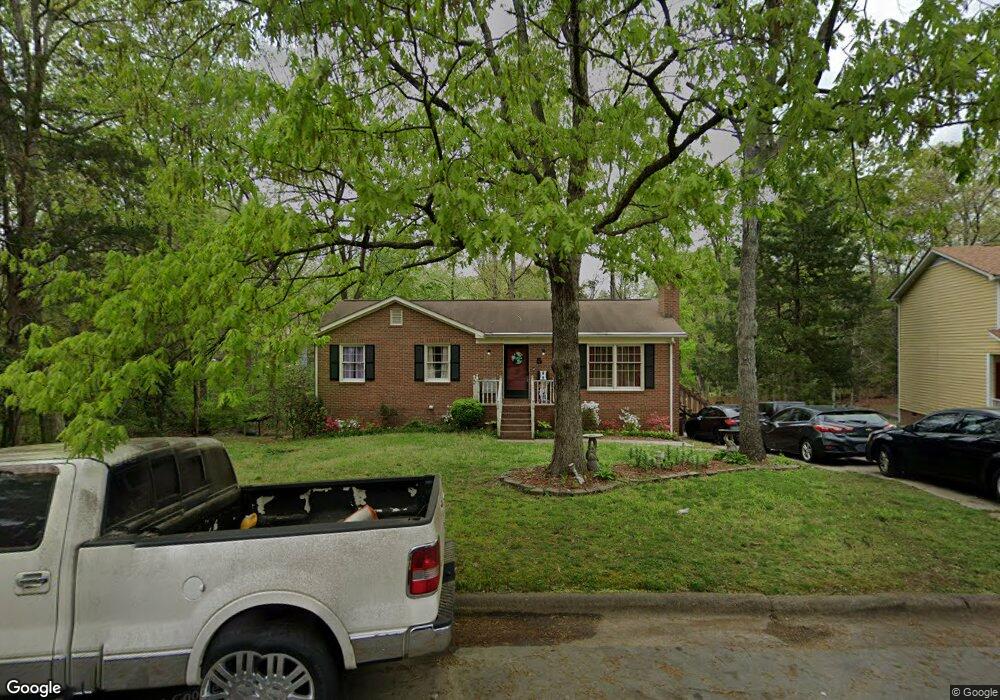
5 McBenson Place Durham, NC 27705
Duke Homestead NeighborhoodEstimated Value: $382,000 - $440,563
3
Beds
2
Baths
2,392
Sq Ft
$170/Sq Ft
Est. Value
About This Home
This home is located at 5 McBenson Place, Durham, NC 27705 and is currently estimated at $406,891, approximately $170 per square foot. 5 McBenson Place is a home located in Durham County with nearby schools including Hillandale Elementary School, George L Carrington Middle, and Riverside High School.
Ownership History
Date
Name
Owned For
Owner Type
Purchase Details
Closed on
Jul 28, 2017
Sold by
Konradd Llc
Bought by
Paylor Mark and Paylor Sherry
Current Estimated Value
Home Financials for this Owner
Home Financials are based on the most recent Mortgage that was taken out on this home.
Original Mortgage
$195,395
Outstanding Balance
$164,301
Interest Rate
4.25%
Mortgage Type
FHA
Estimated Equity
$242,590
Purchase Details
Closed on
Apr 3, 2017
Sold by
Rodgers William
Bought by
Konradd Llc
Create a Home Valuation Report for This Property
The Home Valuation Report is an in-depth analysis detailing your home's value as well as a comparison with similar homes in the area
Home Values in the Area
Average Home Value in this Area
Purchase History
| Date | Buyer | Sale Price | Title Company |
|---|---|---|---|
| Paylor Mark | $199,000 | None Available | |
| Konradd Llc | $134,000 | -- |
Source: Public Records
Mortgage History
| Date | Status | Borrower | Loan Amount |
|---|---|---|---|
| Open | Paylor Mark | $195,395 |
Source: Public Records
Tax History
| Year | Tax Paid | Tax Assessment Tax Assessment Total Assessment is a certain percentage of the fair market value that is determined by local assessors to be the total taxable value of land and additions on the property. | Land | Improvement |
|---|---|---|---|---|
| 2025 | $4,226 | $426,344 | $134,550 | $291,794 |
| 2024 | $2,766 | $198,270 | $25,987 | $172,283 |
| 2023 | $2,597 | $198,270 | $25,987 | $172,283 |
| 2022 | $2,538 | $198,270 | $25,987 | $172,283 |
| 2021 | $2,526 | $198,270 | $25,987 | $172,283 |
| 2020 | $2,466 | $198,270 | $25,987 | $172,283 |
| 2019 | $2,466 | $198,270 | $25,987 | $172,283 |
| 2018 | $2,485 | $183,200 | $27,460 | $155,740 |
| 2017 | $2,467 | $183,200 | $27,460 | $155,740 |
| 2016 | $2,384 | $183,200 | $27,460 | $155,740 |
| 2015 | $2,267 | $163,780 | $32,526 | $131,254 |
| 2014 | $2,267 | $163,780 | $32,526 | $131,254 |
Source: Public Records
Map
Nearby Homes
- 6 McBenson Place
- 2207 Elk River Dr
- 1904 Stadium Dr
- 1206A River Rock Dr
- 4208 Convergence St
- 3256 Cascade Ln
- 3650 Guess Rd
- 1011 Wyldewood Rd
- 1419 Cherrycrest Dr
- 1421 Cherrycrest Dr
- 1425 Cherrycrest Dr
- 1427 Cherrycrest Dr
- 3004 Shaftsbury St
- 812 Chalk Level Rd
- 2706 Ramblegate Ln
- 3300 Alabama Ave
- 14 Justin Ct
- 2900 Cammie St
- 34 Justin Ct
- 2605 Camellia Dr
- 7 McBenson Place
- 1 McBenson Place
- 4 Cairn Ct
- 9 McBenson Place
- 8 Cairn Ct
- 1512 Rowemont Dr
- 11 McBenson Place
- 1517 Rowemont Dr
- 10 McBenson Place
- 1521 Rowemont Dr
- 9 Cairn Ct
- 1513 Rowemont Dr
- 1602 Rowemont Dr
- 1508 Rowemont Dr
- 15 McBenson Place
- 1601 Rowemont Dr
- 1509 Rowemont Dr
- 7 Cairn Ct
- 14 McBenson Place
- 1504 Rowemont Dr
Your Personal Tour Guide
Ask me questions while you tour the home.