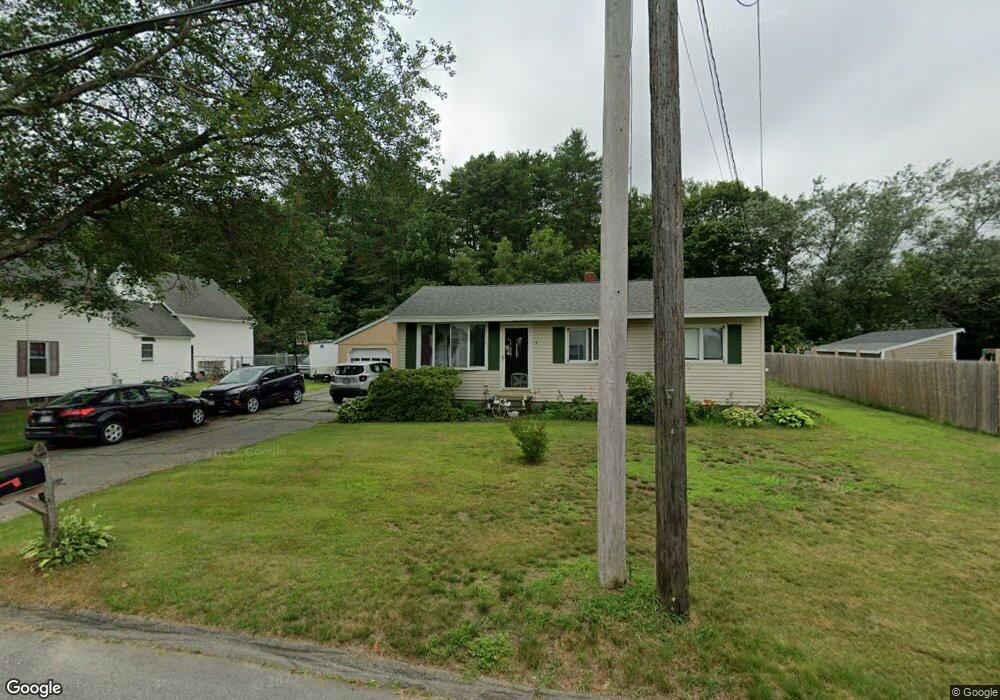
5 Mcclellan St Lisbon, ME 04250
Estimated Value: $301,731 - $376,000
3
Beds
2
Baths
1,087
Sq Ft
$303/Sq Ft
Est. Value
About This Home
This home is located at 5 Mcclellan St, Lisbon, ME 04250 and is currently estimated at $329,183, approximately $302 per square foot. 5 Mcclellan St is a home with nearby schools including Lisbon Community School, Philip W. Sugg Middle School, and Lisbon High School.
Ownership History
Date
Name
Owned For
Owner Type
Purchase Details
Closed on
Apr 26, 2005
Sold by
Ridley Richard A
Bought by
Landry Laurie and Bowen Timothy
Current Estimated Value
Home Financials for this Owner
Home Financials are based on the most recent Mortgage that was taken out on this home.
Original Mortgage
$108,000
Outstanding Balance
$54,218
Interest Rate
5.87%
Mortgage Type
Commercial
Estimated Equity
$274,965
Purchase Details
Closed on
Feb 25, 2005
Sold by
Nelson Dorothy M
Bought by
Ridley Richard A
Home Financials for this Owner
Home Financials are based on the most recent Mortgage that was taken out on this home.
Original Mortgage
$108,000
Outstanding Balance
$54,218
Interest Rate
5.87%
Mortgage Type
Commercial
Estimated Equity
$274,965
Create a Home Valuation Report for This Property
The Home Valuation Report is an in-depth analysis detailing your home's value as well as a comparison with similar homes in the area
Home Values in the Area
Average Home Value in this Area
Purchase History
| Date | Buyer | Sale Price | Title Company |
|---|---|---|---|
| Landry Laurie | -- | -- | |
| Ridley Richard A | -- | -- |
Source: Public Records
Mortgage History
| Date | Status | Borrower | Loan Amount |
|---|---|---|---|
| Open | Landry Laurie | $108,000 |
Source: Public Records
Tax History
| Year | Tax Paid | Tax Assessment Tax Assessment Total Assessment is a certain percentage of the fair market value that is determined by local assessors to be the total taxable value of land and additions on the property. | Land | Improvement |
|---|---|---|---|---|
| 2025 | $4,497 | $260,700 | $46,600 | $214,100 |
| 2024 | $3,546 | $260,700 | $46,600 | $214,100 |
| 2023 | $3,192 | $151,300 | $30,800 | $120,500 |
| 2022 | $3,495 | $151,300 | $30,800 | $120,500 |
| 2021 | $3,344 | $151,300 | $30,800 | $120,500 |
| 2020 | $3,495 | $151,300 | $30,800 | $120,500 |
| 2019 | $3,495 | $151,300 | $30,800 | $120,500 |
| 2018 | $3,244 | $130,600 | $26,800 | $103,800 |
| 2017 | $3,030 | $130,600 | $26,800 | $103,800 |
| 2016 | $2,925 | $130,600 | $26,800 | $103,800 |
| 2015 | $2,100 | $97,700 | $29,000 | $68,700 |
| 2014 | $2,174 | $97,700 | $29,000 | $68,700 |
| 2013 | -- | $97,700 | $29,000 | $68,700 |
Source: Public Records
Map
Nearby Homes
- 25 Village St
- 38 Fairview Dr
- 272 Lisbon St
- M.R6 Lot18 Lisbon St
- 36 Andrea St
- 26 Stanley Dr
- 22 Arrowhead Dr
- 22 Sabattus Creek Dr
- 103 Lisbon St
- 69 Lisbon Street Lots F & G
- 7 Alexander St
- 86 Littlefield Rd
- 6 Macintosh Ln
- 51 Gould Rd
- 277 Ferry Rd
- 11 Pike St
- 13 Frost Hill Ave
- 606 Lisbon St
- 143 Dube Dr
- 27 Bowdoin St
Your Personal Tour Guide
Ask me questions while you tour the home.