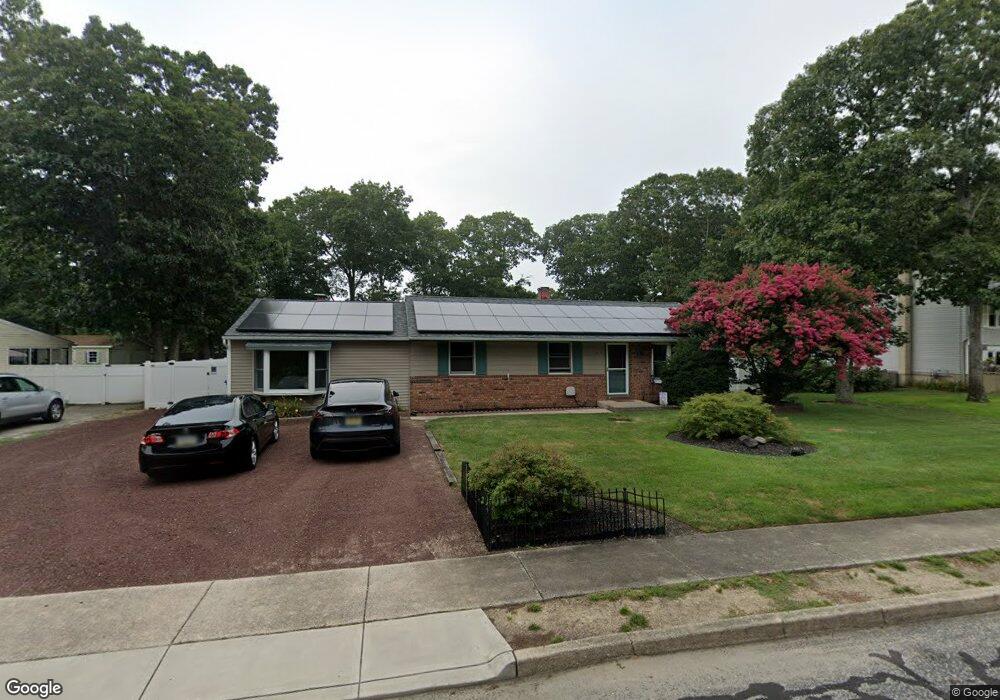
5 McDonald Dr Ocean View, NJ 08230
Estimated Value: $409,694 - $515,000
--
Bed
--
Bath
1,864
Sq Ft
$259/Sq Ft
Est. Value
About This Home
This home is located at 5 McDonald Dr, Ocean View, NJ 08230 and is currently estimated at $481,924, approximately $258 per square foot. 5 McDonald Dr is a home located in Cape May County with nearby schools including Upper Township Primary School, Upper Township Elementary School, and Upper Township Middle School.
Ownership History
Date
Name
Owned For
Owner Type
Purchase Details
Closed on
Jun 25, 2003
Sold by
Ginn Geraldine T
Bought by
Ginn Mary Ann
Current Estimated Value
Home Financials for this Owner
Home Financials are based on the most recent Mortgage that was taken out on this home.
Original Mortgage
$170,400
Outstanding Balance
$63,485
Interest Rate
5.69%
Mortgage Type
New Conventional
Estimated Equity
$418,439
Purchase Details
Closed on
Jul 30, 1999
Sold by
Giglio Anthony
Bought by
Ginn Geraldine T and Ginn Mary Ann
Home Financials for this Owner
Home Financials are based on the most recent Mortgage that was taken out on this home.
Original Mortgage
$122,700
Interest Rate
7.61%
Mortgage Type
FHA
Purchase Details
Closed on
Apr 30, 1993
Sold by
Addario Louis A and Addario Joyce M
Bought by
Giglio Anthony and Giglio Catherine
Create a Home Valuation Report for This Property
The Home Valuation Report is an in-depth analysis detailing your home's value as well as a comparison with similar homes in the area
Home Values in the Area
Average Home Value in this Area
Purchase History
| Date | Buyer | Sale Price | Title Company |
|---|---|---|---|
| Ginn Mary Ann | -- | Fidelity Natl Title Ins Co | |
| Ginn Geraldine T | $126,000 | -- | |
| Giglio Anthony | $111,000 | -- |
Source: Public Records
Mortgage History
| Date | Status | Borrower | Loan Amount |
|---|---|---|---|
| Open | Ginn Mary Ann | $170,400 | |
| Closed | Ginn Geraldine T | $122,700 |
Source: Public Records
Tax History Compared to Growth
Tax History
| Year | Tax Paid | Tax Assessment Tax Assessment Total Assessment is a certain percentage of the fair market value that is determined by local assessors to be the total taxable value of land and additions on the property. | Land | Improvement |
|---|---|---|---|---|
| 2025 | $6,001 | $261,500 | $98,800 | $162,700 |
| 2024 | $6,001 | $261,500 | $98,800 | $162,700 |
| 2023 | $5,706 | $261,500 | $98,800 | $162,700 |
| 2022 | $4,952 | $234,800 | $98,800 | $136,000 |
| 2021 | $3,538 | $234,800 | $98,800 | $136,000 |
| 2020 | $4,597 | $234,800 | $98,800 | $136,000 |
| 2019 | $4,487 | $234,800 | $98,800 | $136,000 |
| 2018 | $4,372 | $234,800 | $98,800 | $136,000 |
| 2017 | $4,323 | $234,800 | $98,800 | $136,000 |
| 2016 | $3,794 | $202,900 | $98,800 | $104,100 |
| 2015 | $3,695 | $202,900 | $98,800 | $104,100 |
| 2014 | $4,216 | $283,500 | $146,200 | $137,300 |
Source: Public Records
Map
Nearby Homes
- 49 Hope Corson Rd
- 1431 Stagecoach Rd
- 127 Route 50
- 86 Route 50
- 3 Sandcastle Dr
- 4 Sandcastle Dr
- 1729 Shore Rd
- 4 W Katherine Ave
- 81 Flounder
- 2058 U S 9
- 16 Winchester Ct
- 10 New Jersey 50
- 3 Kruk Terrace
- 5 Kruk Terrace
- 14 Winchester Ct
- 1731 Route 9 Unit 28
- 11 Laurel Ridge Rd
- 2058 Shore Rd
- 13 Mooring Cir
- 1 New Jersey 50
- 1 McDonald Dr
- 7 McDonald Dr
- 4 Williams Way
- 9 McDonald Dr
- 2 Williams Way
- 1442 Stagecoach Rd
- 4 McDonald Dr
- 6 Williams Way
- 1440 Stagecoach Rd
- 6 McDonald Dr
- 2 McDonald Dr
- 8 McDonald Dr
- 8 Williams Way
- 1438 Stagecoach Rd
- 1448 Stagecoach Rd
- 11 McDonald Dr
- 12 Williams Way
- 10 Williams Way
- 1445 Stagecoach Rd
- 5 Williams Way