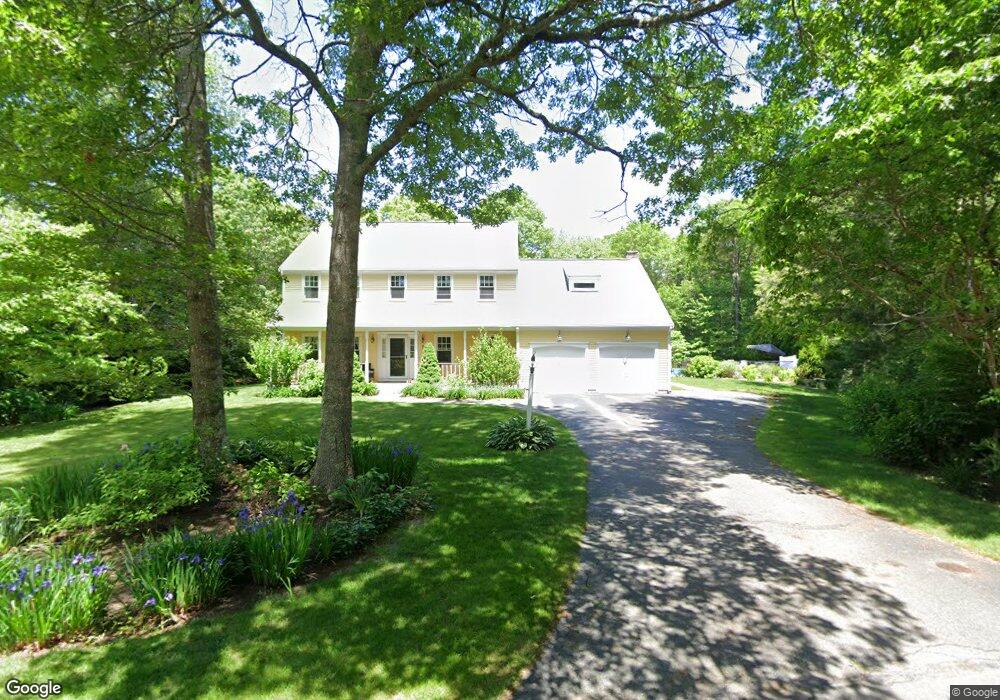
5 Meadow Ln Sandwich, MA 02563
Estimated Value: $926,000 - $1,054,000
4
Beds
3
Baths
3,162
Sq Ft
$314/Sq Ft
Est. Value
About This Home
This home is located at 5 Meadow Ln, Sandwich, MA 02563 and is currently estimated at $991,784, approximately $313 per square foot. 5 Meadow Ln is a home located in Barnstable County with nearby schools including Sandwich Middle High School, Sandwich Montessori School, and Riverview School.
Ownership History
Date
Name
Owned For
Owner Type
Purchase Details
Closed on
Jun 17, 2020
Sold by
Conlan Brian P and Conlan Susan J
Bought by
Conlan Ret
Current Estimated Value
Purchase Details
Closed on
Oct 2, 1995
Sold by
Countryside Bldg Co
Bought by
Conlan Brian P
Home Financials for this Owner
Home Financials are based on the most recent Mortgage that was taken out on this home.
Original Mortgage
$192,500
Interest Rate
7.89%
Mortgage Type
Purchase Money Mortgage
Purchase Details
Closed on
Sep 14, 1994
Sold by
Penderter Harold
Bought by
Countryside Bldg Co
Create a Home Valuation Report for This Property
The Home Valuation Report is an in-depth analysis detailing your home's value as well as a comparison with similar homes in the area
Home Values in the Area
Average Home Value in this Area
Purchase History
| Date | Buyer | Sale Price | Title Company |
|---|---|---|---|
| Conlan Ret | -- | None Available | |
| Conlan Brian P | $242,500 | -- | |
| Countryside Bldg Co | $59,000 | -- |
Source: Public Records
Mortgage History
| Date | Status | Borrower | Loan Amount |
|---|---|---|---|
| Previous Owner | Conlan Brian P | $192,500 |
Source: Public Records
Tax History Compared to Growth
Tax History
| Year | Tax Paid | Tax Assessment Tax Assessment Total Assessment is a certain percentage of the fair market value that is determined by local assessors to be the total taxable value of land and additions on the property. | Land | Improvement |
|---|---|---|---|---|
| 2025 | $8,308 | $786,000 | $140,100 | $645,900 |
| 2024 | $8,459 | $783,200 | $141,800 | $641,400 |
| 2023 | $8,285 | $720,400 | $128,900 | $591,500 |
| 2022 | $7,891 | $599,600 | $124,600 | $475,000 |
| 2021 | $7,494 | $544,200 | $119,800 | $424,400 |
| 2020 | $7,443 | $520,100 | $117,600 | $402,500 |
| 2019 | $7,181 | $501,500 | $124,800 | $376,700 |
| 2018 | $7,166 | $475,500 | $120,600 | $354,900 |
| 2017 | $6,684 | $447,700 | $116,700 | $331,000 |
| 2016 | $6,394 | $441,900 | $115,500 | $326,400 |
| 2015 | $6,521 | $440,000 | $119,700 | $320,300 |
Source: Public Records
Map
Nearby Homes